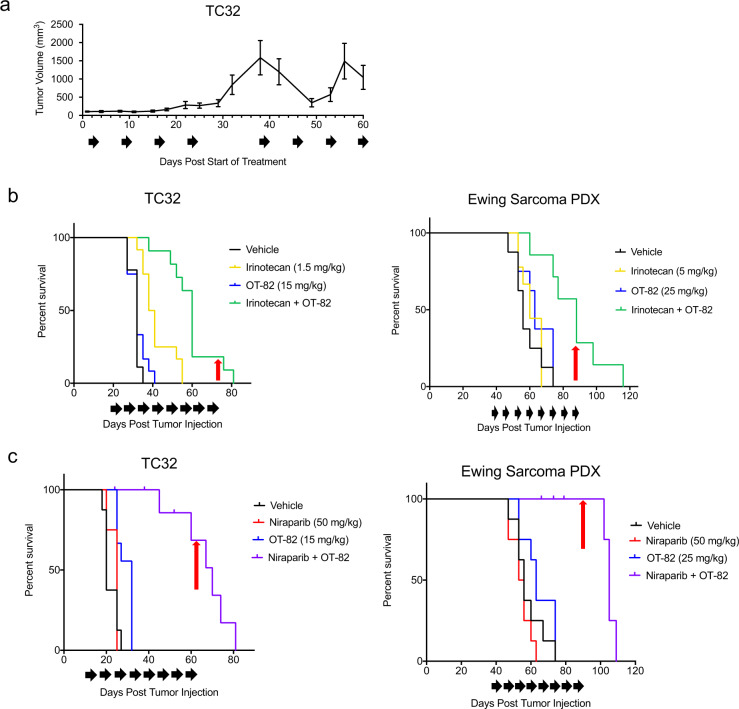
Fig. 6. Combination treatments with agents that augment DNA damage improve single-agent efficacy of low-dose OT-82 in EWS orthotopic xenograft models.
a Tumor growth curve for TC32-bearing xenografts (n = 3) treated with 50 mg/kg OT-82 over an initial 4 week treatment period (mice treated days 1–3, 8–10, 15–17, and 22–24), a 2-week treatment interruption, and an additional 4 week treatment period (mice treated days 38–40, 45–47, 52–54, and 59–60). Black arrows represent treatment schedule. b Kaplan–Meier curves representing survival to endpoint (17 mm in longest tumor diameter) for mice (n = 12/group) bearing EWS xenograft tumors (TC32 and PDX) and treated with vehicle or the indicated doses of OT-82, irinotecan (daily on 2 of every 7 days for TC32; 5 of every 7 days for PDX) or the combination. Black arrows represent treatment schedule; red arrows represent final day of treatment. In TC32 xenografts, p = 0.0004 for irinotecan compared to combination, p < 0.0001 for OT-82 compared to combination; in the PDX, p = 0.0018 for irinotecan compared to combination, p = 0.0065 for OT-82 compared to combination using Mantel–Cox analysis. c Kaplan–Meier curves representing survival to endpoint (17 mm in longest tumor diameter) for mice (n = 12/group) bearing EWS xenograft tumors (TC32 and PDX) and treated with vehicle, or the indicated doses of OT-82, niraparib (daily on 5 of every 7 days) or the combination. Black arrows represent treatment schedule; red arrows represent final day of treatment. In TC32 xenografts, p = 0.0001 for niraparib compared to combination, p < 0.0001 for OT-82 compared to combination; in the PDX, p < 0.0001 for niraparib compared to combination, p = 0.0003 for OT-82 compared to combination using Mantel–Cox analysis.

