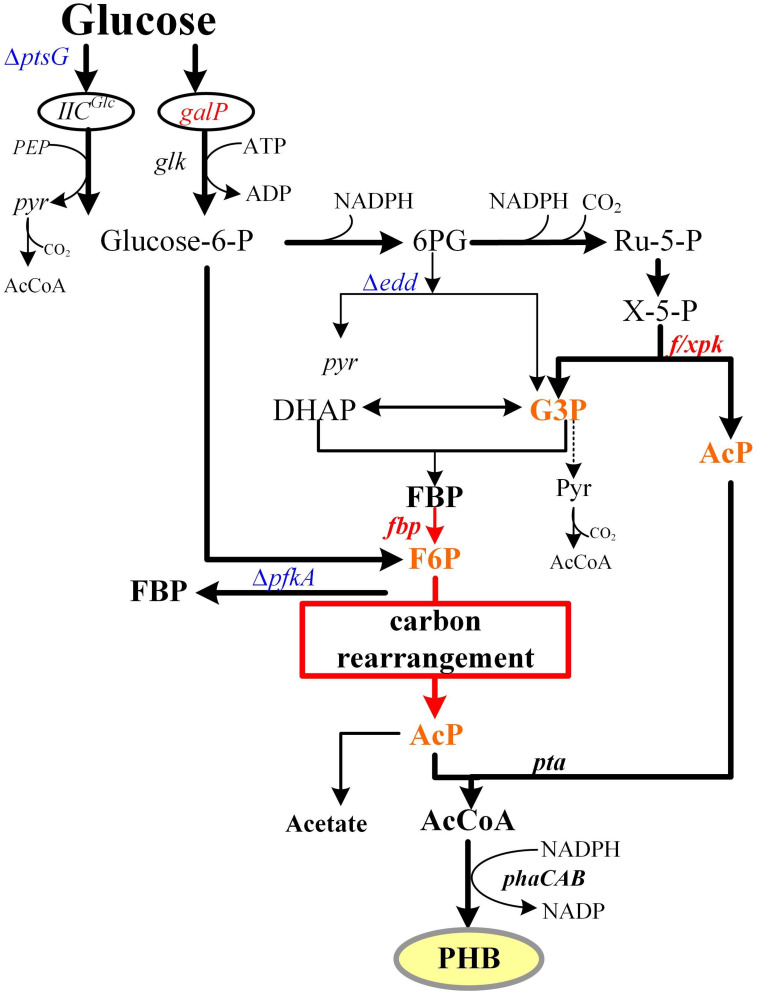
FIGURE 1.
EP-bifido pathway and theory carbon flux distribution. Metabolic optimization of EP-bifido pathway. The red box referred to the carbon rearrangement procedure. Overexpressed genes are shown in red. Deleted genes are shown in blue. Intermediate metabolites participated in carbon rearrangement are shown in orange.

