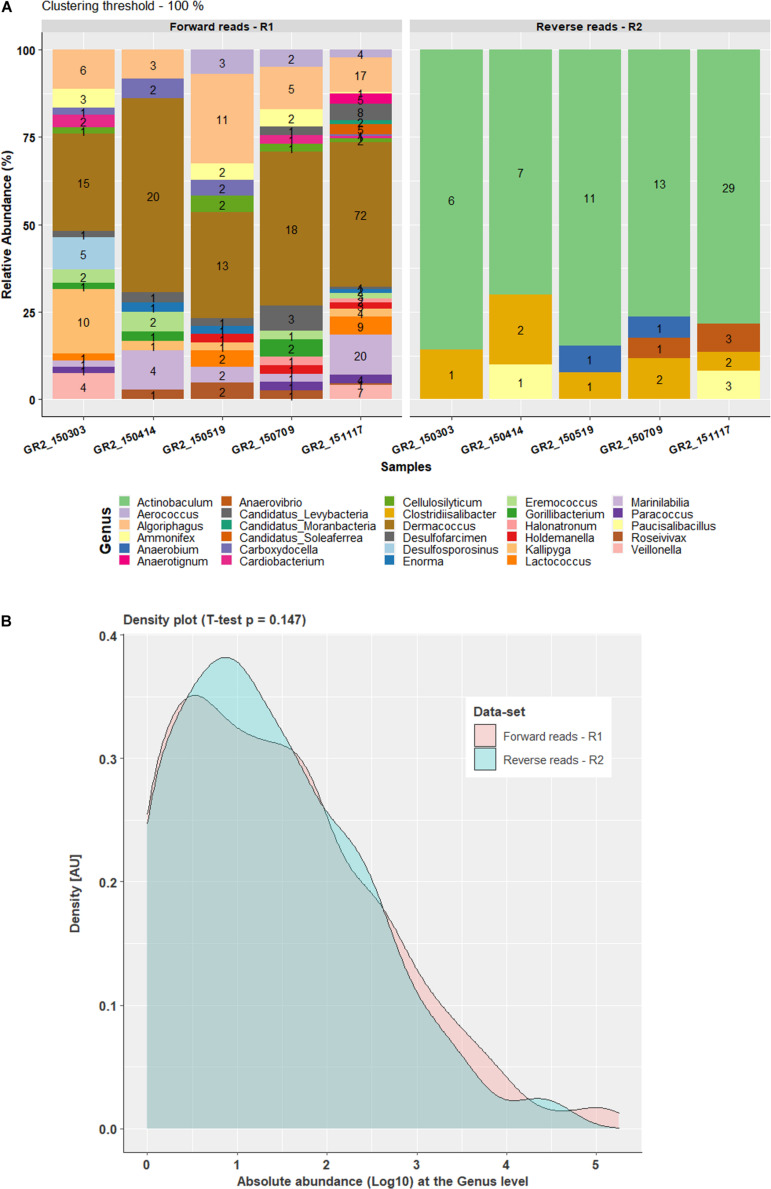
FIGURE 3.
Comparison of forward and reverse reads data-set at genus level with 100% clustering threshold. (A) Bar plot representing the percentage difference in the relative abundance of the unique OTUs for the forward and reverse taxonomy at the genus level, where values on the bars indicate the count of the respective OTU in the abundance table. (B) Density plot for comparison of log10-transformed complete datasets of the forward and reverse read absolute abundance at the genus level.

