FIGURE 6.
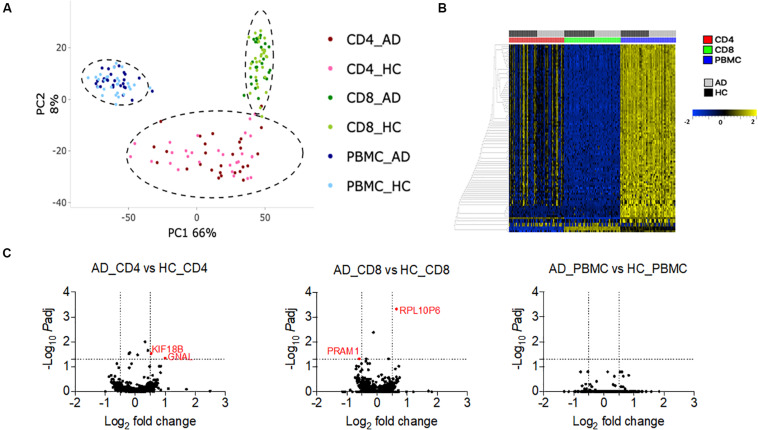
Transcriptomic profile of PBMC, CD4 memory and CD8 memory T cells in AD and HC (A). PCA analysis of gene expression data from PBMC (HC n = 28 and AD n = 27), CD4 memory (HC n = 28 and AD n = 27), and CD8 memory (HC n = 30 and AD n = 26) T cells of HC and AD (B). Heat map of the top 100 variable genes in PBMC, CD4 memory, and CD8 memory T cells (C). Volcano plots show log2 fold change vs. –log10 padj value for the comparison between AD and HC PBMC, AD, and HC CD4 memory and AD and HC CD8 memory T cells. Dotted lines indicate the cut off limit of log2 fold change (on x-axis) and –log10 padj (on y-axis). Because most of the genes are non-significant, they fall on the axis. The genes with log2 fold change greater than 0.5 or less than –0.5 and adjusted p-Value less than 0.05 are considered significant and are represented in red.

