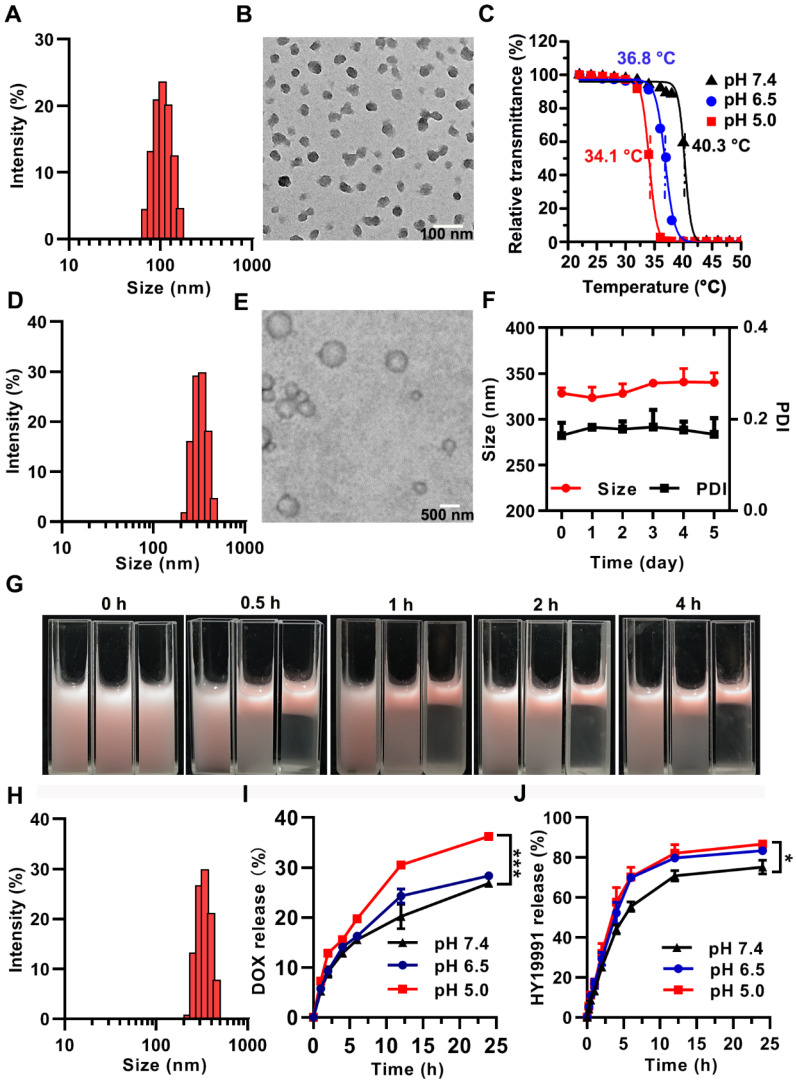
Figure 2.
Characterization of SNG, PNE and D/HY@PNE. (A) Distribution of hydrodynamic diameter and (B) TEM image of SNG. (C) LCST measurement of SNG at different pH values by the transmittance analysis. (D) Hydrodynamic diameter and (E) TEM image of PNE. (F) Changes of the hydrodynamic diameter and PDI of PNE with time. (G) Photos of NR@PNE with different pH values and incubated at 37 °C for different times. From left to right, the pH value is 7.4, 6.5, and 5.0. (H) Hydrodynamic diameter of D/HY@PNE. (I) Cumulative released DOX and (J) HY19991 from D/HY@PNE at different pH values and time points; *p < 0.05, ***p < 0.001.

