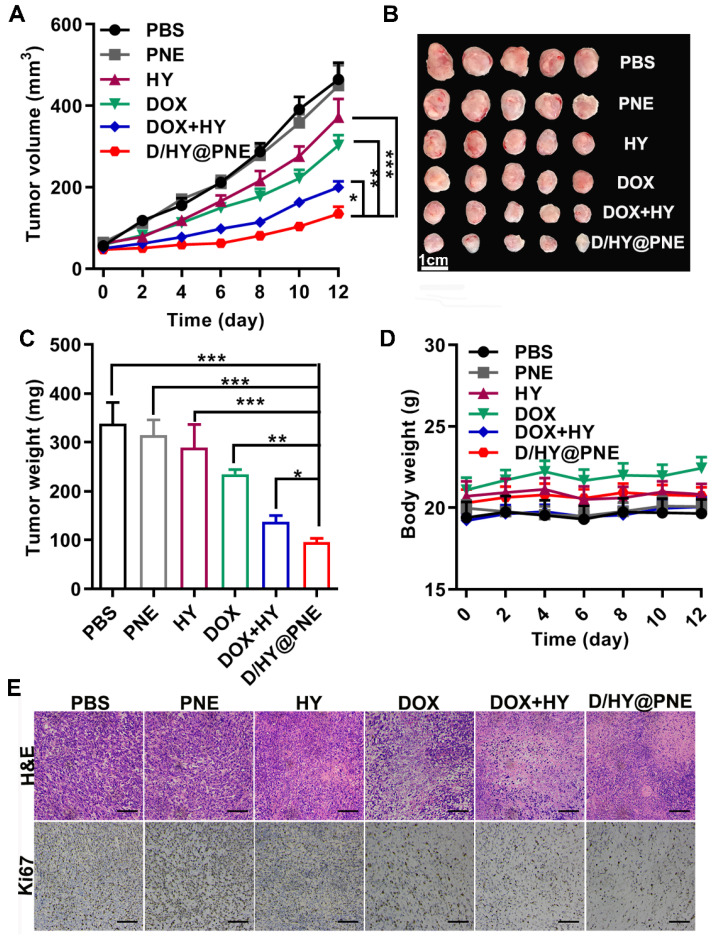
Figure 6.
Antitumor efficacy of D/HY@PNE in vivo. (A) Tumor growth curves in 4T1 tumor-bearing mice after various treatments. (B) Images of the tumors at the end of antitumor studies. (C) Tumor weight at the end of various treatments. (D) Body weight of 4T1-bearing mice. (E) H&E and Ki67 analysis of tumor tissues with various treatments. The scale bar is 50 µm; *p < 0.05, **p < 0.01, ***p < 0.001.

