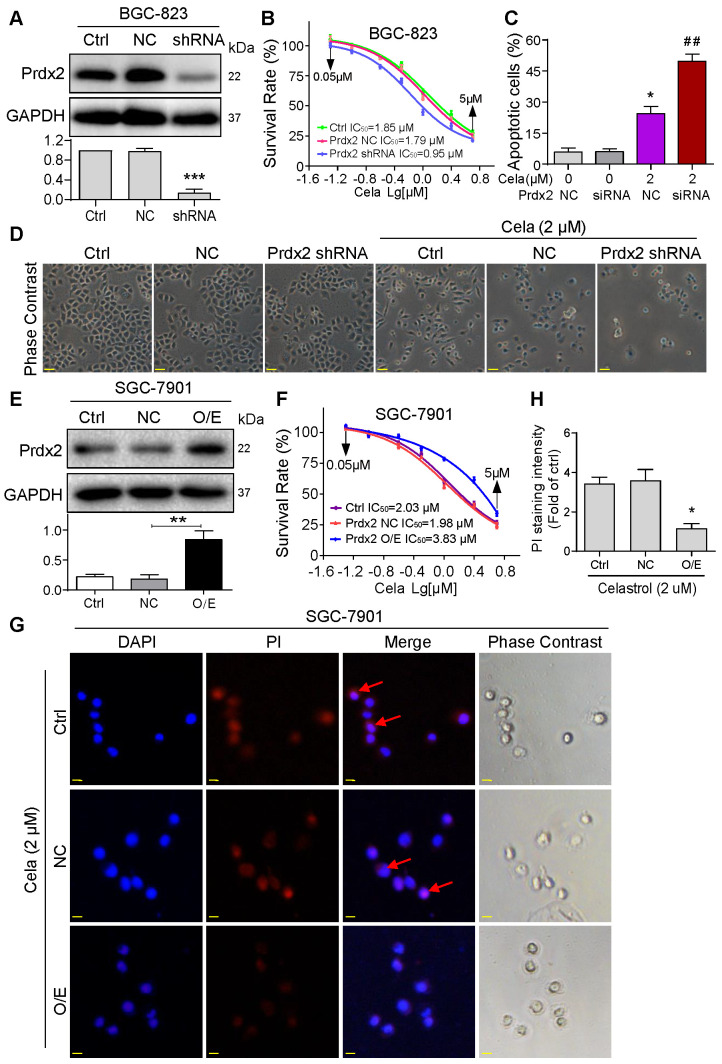
Figure 4.
Knockdown of Prdx2 potentiates and overexpression normalizes the activities of Celastrol. (A) BGC-823 cells were stably transfected with negative control shRNA plasmid or shRNA targeting Prdx2. Total cell lysates were probed for Prdx2. GAPDH was used as loading control. Densitometric quantification is shown in lower panel. (B) Knockdown of Prdx2 in BGC-823 cells by shRNA transfection enhances Celastrol-induced cytotoxicity as determined by the MTT assay. (C) Knockdown of Prdx2 by siRNA transfection in BGC-823 cells significantly increased Celastrol-induced apoptotic cells. Cells were exposed to Celastrol at 2 µM for 24 h. Apoptosis was determined by Annexin/PI staining (siRNA = Prdx2 siRNA, NC = negative control siRNA; n = 3; *P<0.05, **P<0.01 compared to 0 µM Celastrol NC). (D) Representative phase contrast images of cells exposed to Celastrol for 24 h after Prdx2 knockdown (scale bar = 40 µm). (E) SGC-7901 cells were stably transfected with empty vector (NC) or Prdx2 cDNA (O/E). Lysates were probed for Prdx2 protein levels. GAPDH was used as loading control. Densitometric quantification is shown on right (n = 3; *P<0.05 compared to NC). (F) Prdx2 overexpressing cells and vector control transfected cells were exposed to Celastrol for 24 h. Cell viability was measured by MTT assay. IC50 values are shown. (G) PI staining of SGC-7901 cells showing reduced apoptosis (red; arrows) in cells expressing Prdx2 O/E plasmids. Cells were counterstained with DAPI (Blue) (scale bar = 10 µm). (H) The quantification of PI fluorescence intensity in cells expressing Prdx2 O/E plasmids (n = 3; *P<0.05 compared to NC).

