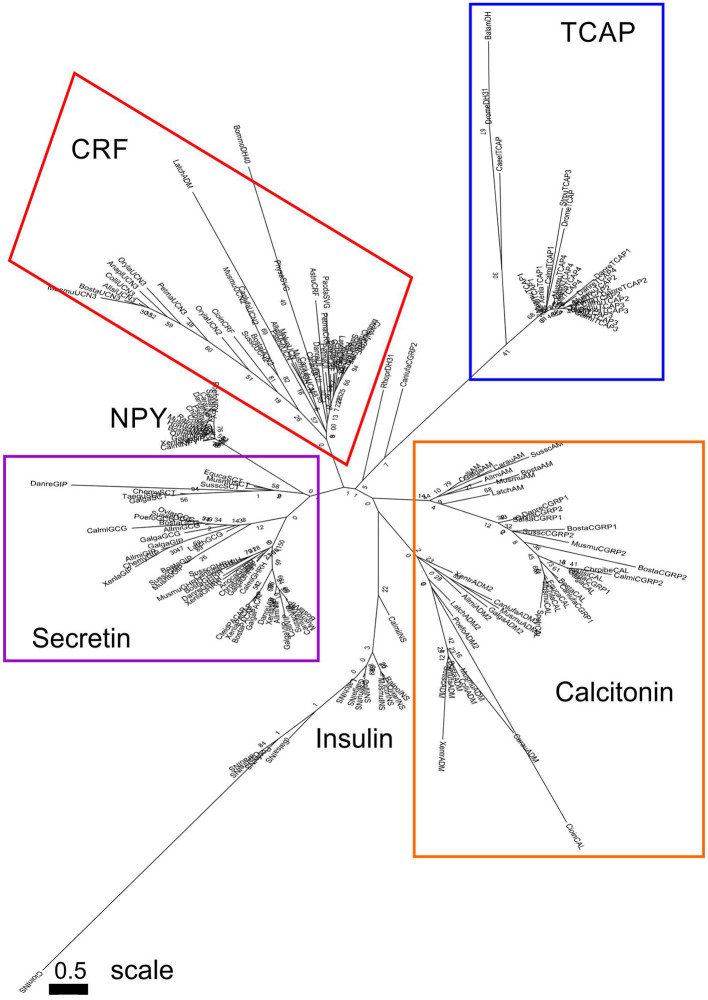
Figure 3.
Phylogenetic analysis of CRF, calcitonin, insulin, and secretin family pre-propeptides with TCAP propeptides (rooted to TCAP). Each family is highlighted with a different color: CRF (red), calcitonin (orange), secretin (purple), TCAP (blue). Analysis was conducted using the maximum likelihood method based on the JTT+G matrix-based model (lnL = −11224.5064; +G, parameter = 1.3976) (41). Initial trees for the heuristic search were obtained by applying the NJ method to a matrix of pairwise distances estimated using a JTT model. Branch lengths represent the number of substitutions per site, with the tree shown to scale. Bootstrap analysis involved 1,000 replicates. CRF family: CRF, corticotropin-releasing factor; TCN, teleocortin; UCN, urocortin; UCN2, urocortin 2; UCN3, urocortin 3; UI, urotensin; SVG, sauvagine; DH, diuretic hormone; Calcitonin family: CALC, calcitonin; CGRP1, calcitonin-gene-related peptide 1; CGRP2, calcitonin-gene-related peptide 2; AM, amylin; ADM, adrenomedullin; ADM2, adrenomedullin 2; Secretin family: SCT, secretin; GHRH, growth hormone releasing hormone; GIP, gastric inhibitory peptide; GCG, glucagon; PACAP, pituitary adenylate cyclase-activating peptide; VIP, vasoactive intestinal peptide; Reference groups: NPY, neuropeptide Y; INS, insulin; Outgroup: TCAP, teneurin C-terminal associated peptide. The scale bar indicates the level of magnification for the tree.

