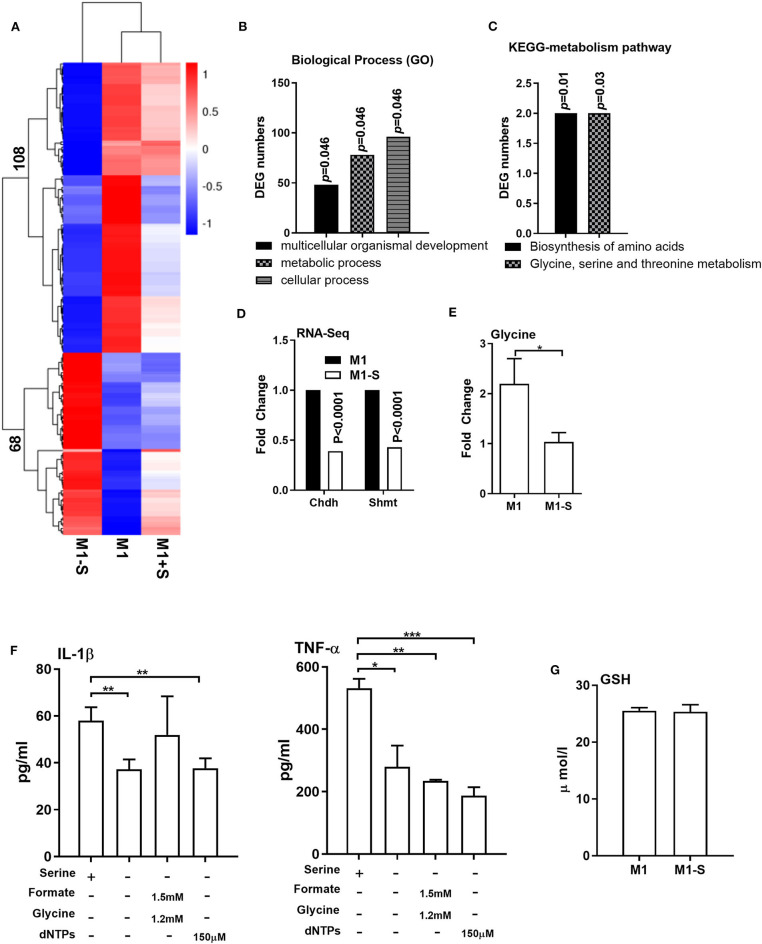
Figure 2.
Serine deprivation alters the transcriptomic profile of M1 macrophages. (A) Heatmap analysis of up-regulated or down-regulated genes among different groups (n = 4). (B) GO analysis of DEG numbers which enriched in biological process between M1 and M1-S (n = 4). (C) The effect of serine deprivation on “Biosynthesis of amino acids” and “Glycine, serine, and threonine metabolism” with KEGG analysis of DEGs. (D) The relative mRNA expression of Chdh and Shmt with RNA-Seq (n = 4). (E) The intracellular level of glycine in M1 or M1-S (n = 6). (F) Production of IL-1β and TNF-α from TGPMs stimulated with LPS (1 μg/ml) plus IFN-γ (20 ng/ml) in completed medium, serine-depleted medium, or serine-depleted medium supplemented with formate (1.5 mM) and glycine (1.2 mM) or dNTPs (150 μM) (n = 4). Data are representative of two independent experiments. Data were analyzed by Mann-Whitney test and shown as the means ± SD. (G) The intracellular level GSH in TGPMs (n = 4). M1-S: thioglycolate-elicited peritoneal macrophages (TGPMs) were stimulated with LPS (1 μg/ml) plus IFN-γ (20 ng/ml) in serine deficiency medium; M1: TGPMs were stimulated with LPS (1 μg/ml) plus IFN-γ (20 ng/ml) in completed medium; M1+S: TGPMs were stimulated with LPS (1 μg/ml) plus IFN-γ (20 ng/ml) in medium with serine supplementation at dosage of 1.2 mM. Macrophages were stimulated with LPS plus IFN-γ for 15 h except indicated. Data were analyzed with one-way ANOVA (F) or unpaired t test (D,E,G) and represented as means ± SD except indicated. *P < 0.05, **P < 0.01, ***P < 0.001.

