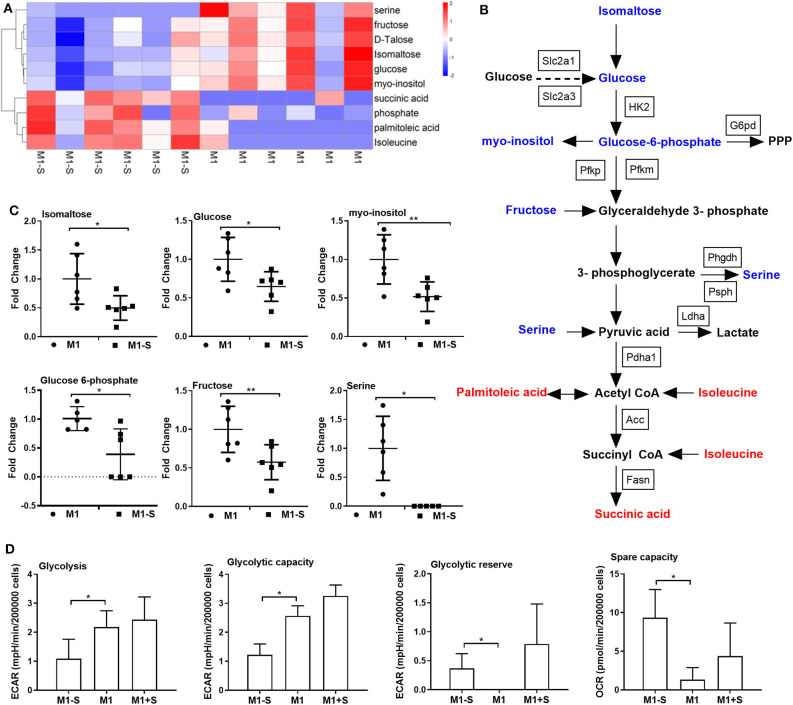
Figure 3.
Serine deprivation results in metabolic reprogramming in M1 macrophages. (A) Heatmap analysis of different metabolites between M1 and M1-S after metabolomics analysis (n = 6). (B) The different metabolites in glycolysis after serine deprivation, decreased metabolites are in blue color, while increased metabolites are in red color (n = 6). (C) The fold change of different intracellular metabolites between M1 and M1-S (n = 6). Data were analyzed by unpaired t-test and shown as the means ± SD. (D) The extracellular acidification rate (glycolysis, glycolysis capacity and glycolysis reverse) and spare capacity of oxygen consumption rate among M1-S, M1, and M1+S (n = 4). M1-S: thioglycolate-elicited peritoneal macrophages (TGPMs) were stimulated with LPS (1 μg/ml) plus IFN-γ (20 ng/ml) in serine-deficient medium; M1: TGPMs were stimulated with LPS (1 μg/ml) plus IFN-γ (20 ng/ml) in completed medium; M1+S: TGPMs were stimulated with LPS (1 μg/ml) plus IFN-γ (20 ng/ml) in medium with serine supplementation at dosage of 1.2 mM. Macrophages were stimulated with LPS plus IFN-γ for 15 h except indicated. Data were analyzed with one-way ANOVA (D) or unpaired t-test (C) and represented as mean ± SD except indicated.*P < 0.05, **P < 0.01.

