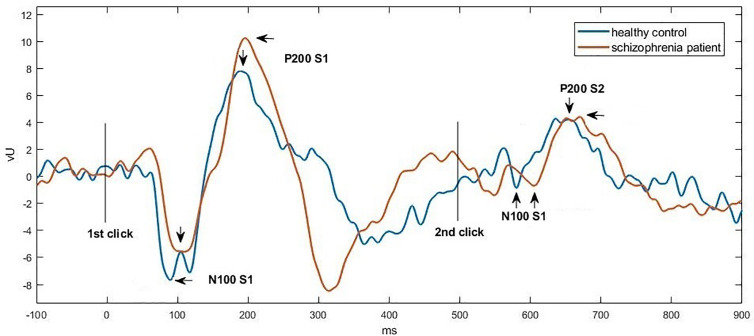
Figure 2.
Grand average waveforms of N100-P200 at Cz in a control subject (blue) vs. a schizophrenia participant (orange), respectively. Click stimuli were presented at time zero (first click) and at 500 ms (second click). The potential was filtered between 1 and 50 Hz to optimize scoring of the N100 and P200 components. The N100 peak was identified as the most negative deflection in the 80 to 150 ms poststimulus interval, and the P200 peak was defined as the most positive deflection in the 150 to 250 ms poststimulus interval.

