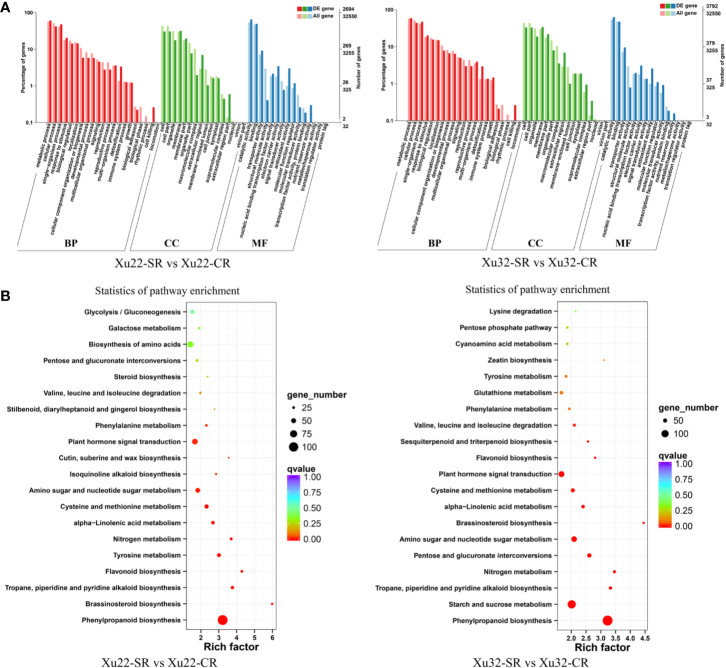
Figure 2.
GO classifications and KEGG pathways of the DEGs in the fibrous roots of Xu22 and Xu32 under salt stress. (A) GO classifications of the annotated DEGs. The left Y-axis indicates the percentage of DEGs identified, and the right Y-axis indicates the number of DEGs. The DEGs were categorized based on the annotations of GO, and the numbers are displayed according to the biological process (BP), cellular component (CC), and molecular function (MF). (B) Enriched KEGG pathways of the DEGs in Xu22 and Xu32 under salt stress. X-axis and Y-axis represent the GeneRatio and the terms of pathways, respectively. Coloring correlates with the q-value. The lower the q-value, the more significant the enrichment. Point size correlates with the numbers of DEGs.

