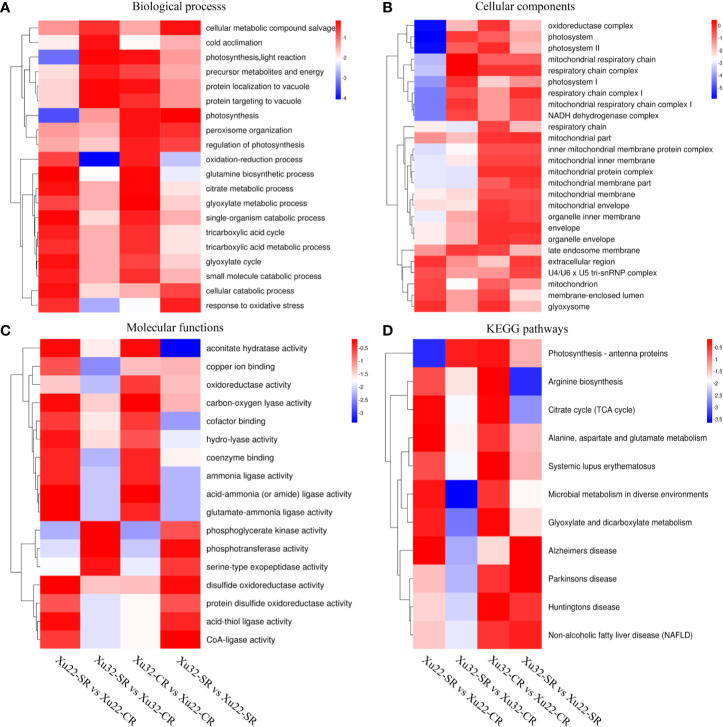
Figure 3.
Heatmaps of the enriched GO classifications and KEGG pathways of differentially expressed proteins (DEPs) in Xu22 and Xu32 in proteome analysis. (A–C) The biological process (BP, A), cellular component (CC, B), and molecular function (MF, C) of the GO classifications of the annotated DEPs. (D) Enriched KEGG pathways of the DEPs in Xu22 and Xu32. The color scales at right indicate the relative expression. Red and blue shading indicate the relative high or low expression levels, respectively.

