Figure 6.
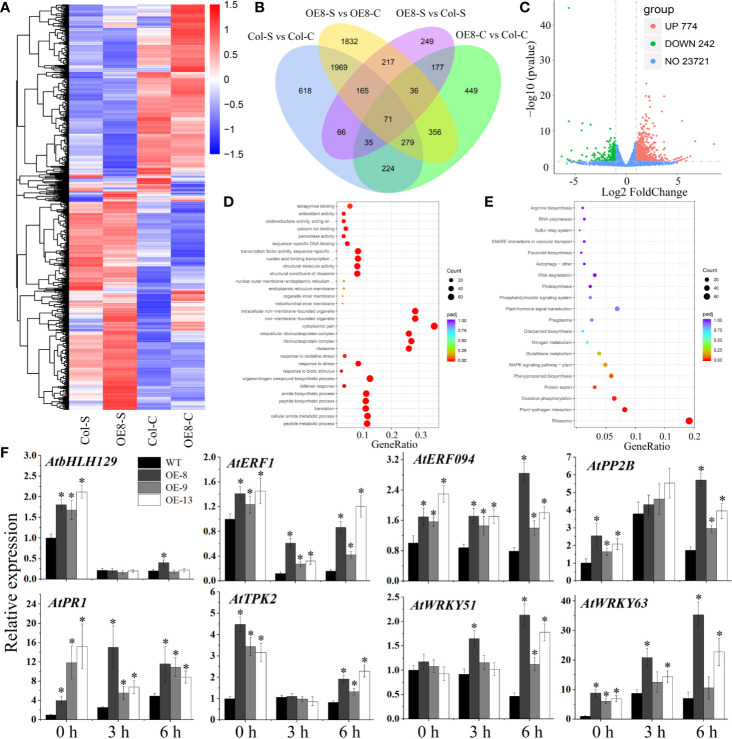
RNA-seq analysis of stress-related genes affected by IbNAC7 under salt stress. (A) The DEGs were hierarchically clustered according to the Log10 (FPKM+1) values. The red and blue bands represent induced and repressed DEGs, respectively. (B) Venn diagrams between WT and transgenic plants suggested specific DEGs and shared DEGs under control and salt stress conditions. Overlapping region indicates co-expressed DEGs between WT and transgenic plants. The numbers only in one circle represent DEGs expressed only in WT or transgenic plants. (C) Volcano plot of DEGs in OE-8 vs WT plants after salt treatment. The red and green dots represent the upregulated and downregulated DEGs, respectively, and the blue dots represent non-DEGs. (D, E) GO classifications (D) and KEGG pathways (E) of annotated upregulated genes in OE-8 vs WT plants under salt stress. X-axis and Y-axis represent the GeneRatio and the category names, respectively. Coloring correlates with the padj. The lower the padj, the more significant the enrichment. The point size correlates with the number of DEGs. (F) Validation of the expression of selected stress-related genes by qRT-PCR between WT and transgenic plants under normal and salt stress conditions. 10-d-old plants were soaked in liquid 1/2 MS medium containing 100 mM NaCl solution for 3 and 6 h, and then the whole plants before and after NaCl treatment were collected. The relative expression levels were normalized to 1 in WT plants at 0 h. Data are the means ± SE of three independent biological experiments. Asterisks indicate statistical significance (*P < 0.05) between the WT and transgenic plants.

