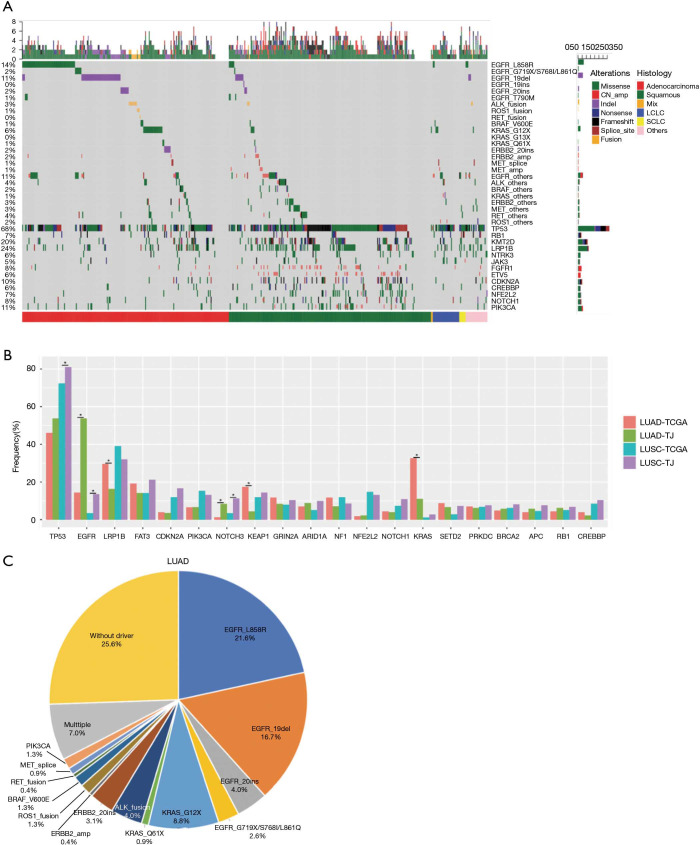
Figure 1.
Overall mutation landscape identified by cancer related 295-gene panel. (A) Landscape of somatic mutations identified in the cohort of 511 lung cancer patients. The top bar indicates the mutation number of an individual patient harbors. The side bar presents the total patient number identified with the corresponding mutation. Bottom categories indicate histology subtypes; (B) distribution of mutation frequencies in our cohort compared with TCGA cohort. Different colors indicate different histology sub-groups from our cohort and TCGA population. Asterisk indicates significant different statistically (P value <0.05); (C) pie chart of alterations in driver genes in our LUAD cohort. Mix, adenosquamous carcinoma; LCLC, large-cell neuroendocrine carcinoma; SCLC, small cell lung cancer; LUAD, lung adenocarcinomas.

