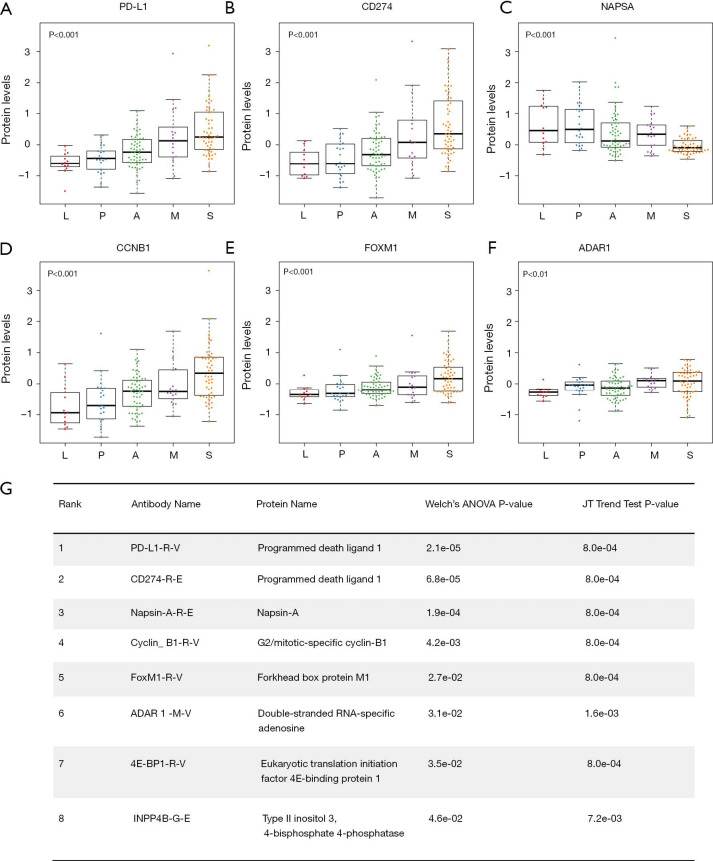
Figure 1.
Top hits identified in the RPPA dataset. (A,B,C,D,E,F) Protein levels of PD-L1, CD274, NAPSA, CCNB1, FOXM1 and ADAR1. P value, Jonckheere-Terpstra test. (G) The rank, antibody name, protein name, Welch’s ANOVA P values and Jonckheere-Terpstra test P values for each hit identified from the RPPA dataset. Bonferroni method was used to adjust the Welch’s ANOVA P values. L, lepidic predominant ADC; P, papillary predominant ADC; A, acinar predominant ADC; M, micropapillary predominant ADC; S, solid predominant ADC; JT, Jonckheere-Terpstra; RPPA, reverse phase protein array.

