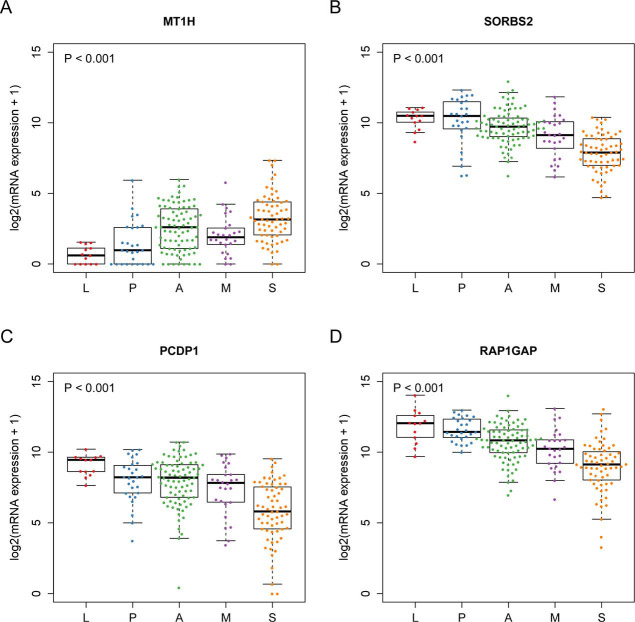
Figure S2.
mRNA expressions of the top 4 hits identified Welch’s ANOVA in the mRNA expression dataset. (A) Metallothionein 1H (MT1H); (B) sorbin and SH3 domain containing 2 (SORBS2); (C) cilia and flagella associated protein 221 (PCDP1); (D) RAP1 GTPase activating protein (RAP1GAP). P value, Jonckheere-Terpstra test.

