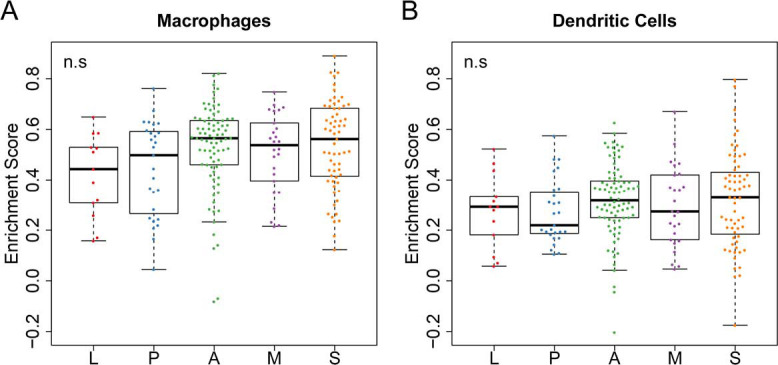
Figure S6.

Immune cell activity enrichment scores in the discovery cohort. (A,B) the estimated enrichment score of macrophages and dendritic cells. P value, Welch’s ANOVA. L, lepidic predominant ADC; P, papillary predominant ADC; A, acinar predominant ADC; M, micropapillary predominant ADC; S, solid predominant ADC.
