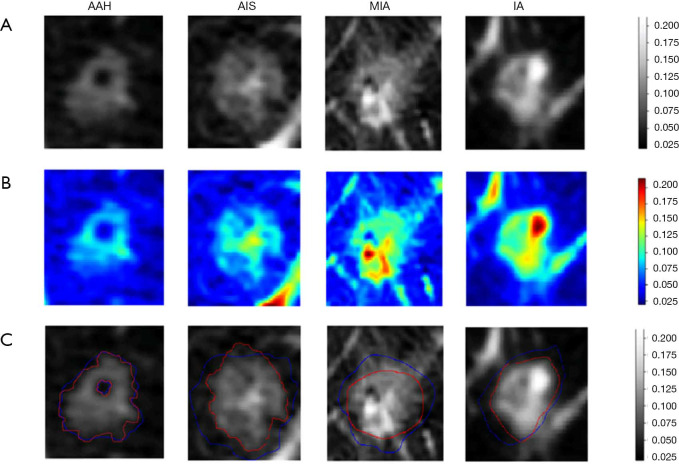
Figure 4.
The figure illustrated the results for algorithm learning and automatic segmentation. The first to last columns were lung nodule examples selected from AAH, AIS, MIA and IAC respectively. (A) The first row showed the original CT images of tumor area. (B) The second row showed the heat maps of the corresponding tumor area. Grad-CAM method was used to visualize the region of interest learned by XimaNet. The color bar on the most right illustrated the attention degree the algorithm paid on. (C) The third row was the segmentation result predicted by XimaSharp (red circle areas were the automatic segmentation result and blue circle areas were the ground truth).

