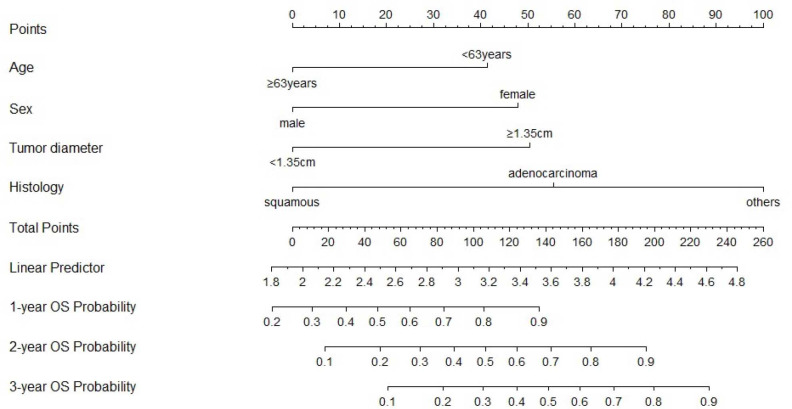
Figure S3.
Nomogram based on the results of multivariate Cox regression analysis of overall survival (OS). The 1-, 2- and 3-year of OS probability in patients was estimated with the prognostic factors. Draw an upward vertical line from the covariate to the points bar to calculate points, based on the sum of the covariate points, than draw a downward vertical line from the total points line to calculate OS.

