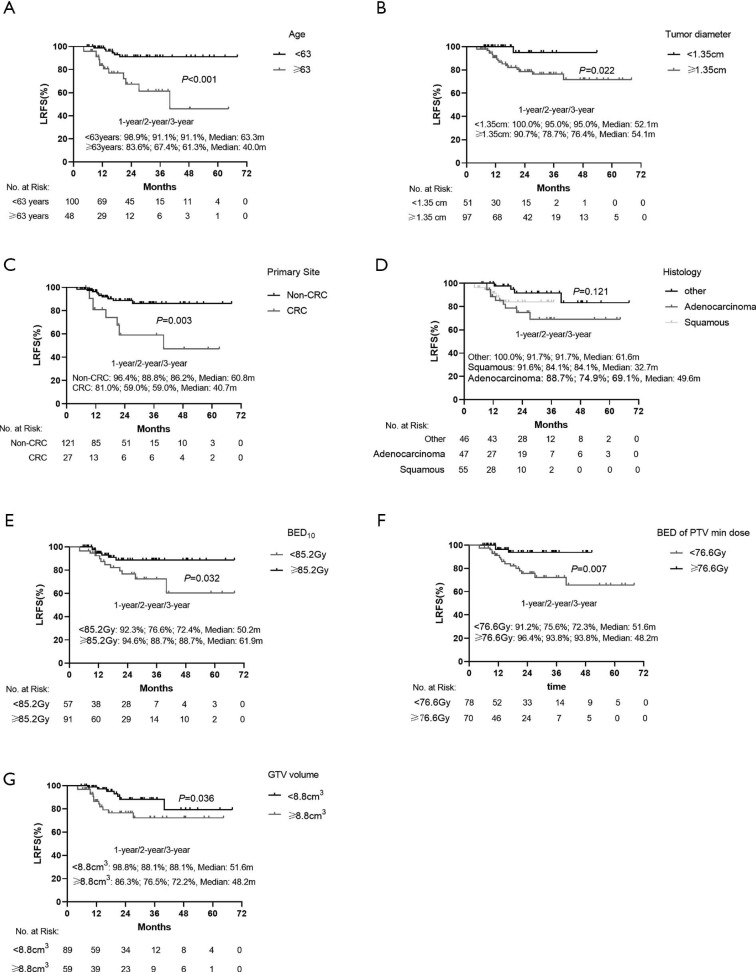
Figure S4.
Kaplan-Meier analysis of local recurrence-free survival (LRFS) in different subgroups, age (A); tumor diameter (B); primary site (C); histology (D); BED10 (E); BED10 of PTV min dose (F); GTV volume (G). The median LRFS time in different subgroups was showed, the percent survival of 1-, 2- and 3-year of LRFS rate and the number at risk was also presented, respectively.

