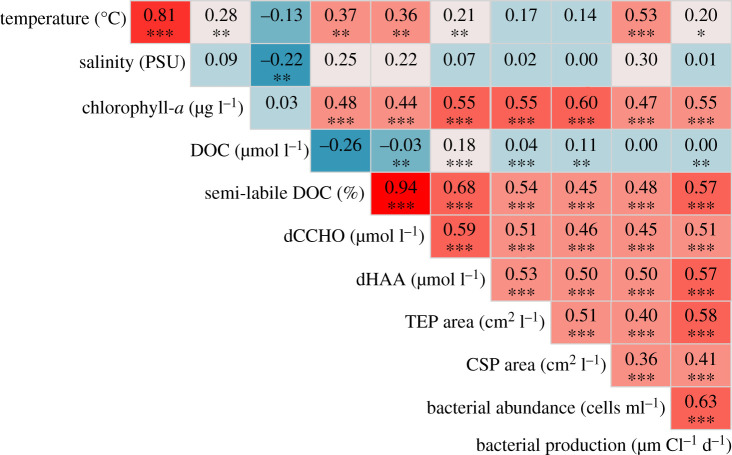
Figure 3.
Correlations of physical and biochemical parameters in the upper 100 m of the Fram Strait in 2018. Low correlations are shown in a blue shade, followed by teal, grey, salmon and red indicating a strong correlation. Significances are shown by asterisks as ‘***’ <0.001, ‘**’ <0.01, ‘*’ <0.05 and ‘ ’ >0.05. (Online version in colour.)

