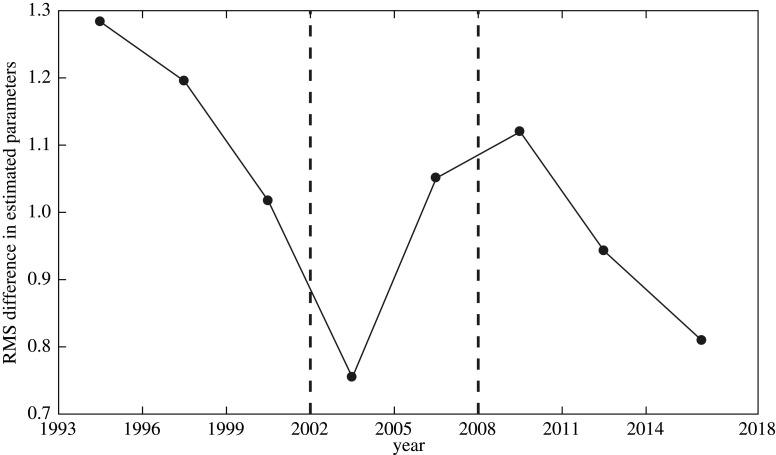
Figure 3.
Computation of root-mean-square (RMS) differences between successive parameter guesses. For example, the point in the middle of 1996 and 1999 represents the RMS difference equation (2.7) between the parameters describing the data from 1993 to 1996 and the parameters describing the data from 1993 to 1999. 2002 is the last year for which the RMS difference is decreasing. In 2005, it is increasing. We take the first parameter segment to be from 1993 to 2002. Afterwards, the RMS difference decreases and, consequently, we define another parameter segment from 2008 to 2018. This suggests that there may be three different parameter regimes in the time-series.

