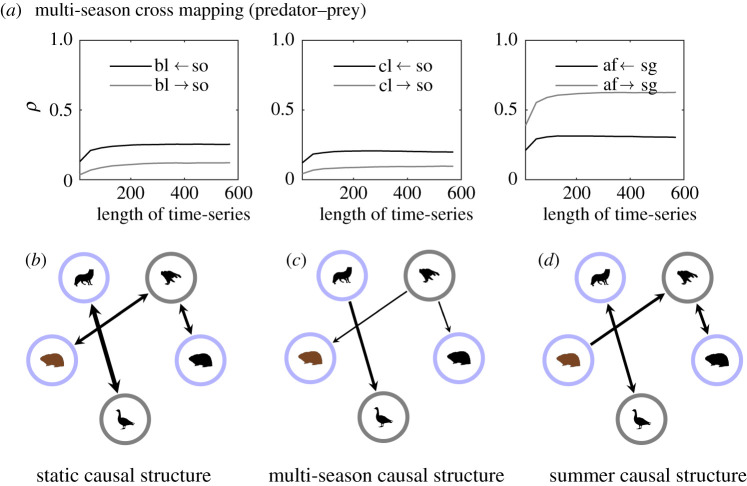
Figure 8.
(a) Cross maps averaged over 50 simulations for the multi-season model between predator–prey species. Cross maps for the static and summer models can be found in electronic supplementary material, figures S3 and S4, respectively. Only correlation coefficients, ρ, which are significantly different from zero (p < 0.05) are shown (see electronic supplementary material, section 3). A causal relationship is indicated if ρ increases as the length of the time-series increases and if ρ converges to a fixed value. Species 1 ← species 2 means that species 2 causes species 1 if the above criteria are met. Here bl, brown lemming; cl, collared lemming; af, Arctic fox; sg, snow goose and so, snowy owl. If a causal relationship is not present, then ρ can be taken to represent the degree of correlation between the variables. (b–d) Represent the strongest causal direction in the cross map for the three different models. The thickness of the lines represent the magnitude of ρ. A thicker line means a larger ρ. (Online version in colour.)

