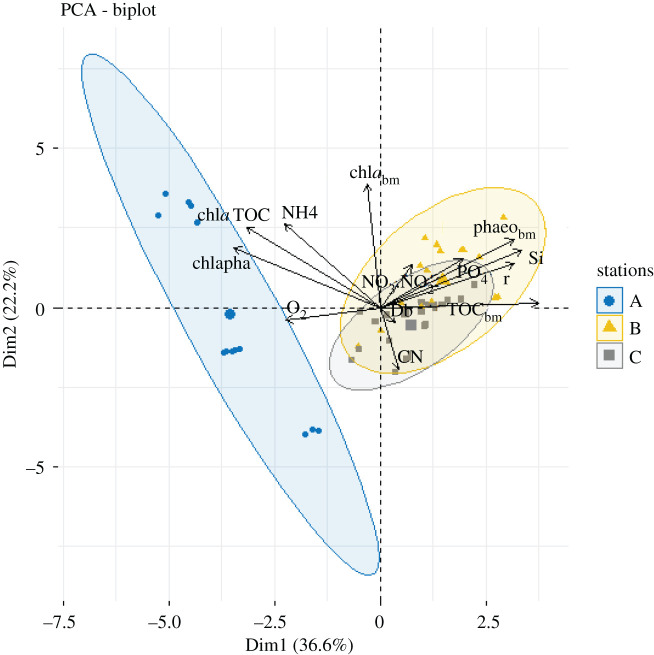
Figure 5.
Principal component analysis based on the sediment variables (C:N, chla:phaeo and C-chla:TOC ratios, biomass of TOC, chla and phaeo pigments), benthic fluxes (oxygen, ammonium (NH4), nitrate + nitrite (NO3 + NO2), phosphate (), silicate , and bioturbation coefficients (biodiffusion, Db and bioadvection, r) along the Kongsfjorden area between 2012 and 2015. The two axes pictured explain 58.8% of the variance in station data. (Online version in version.)

