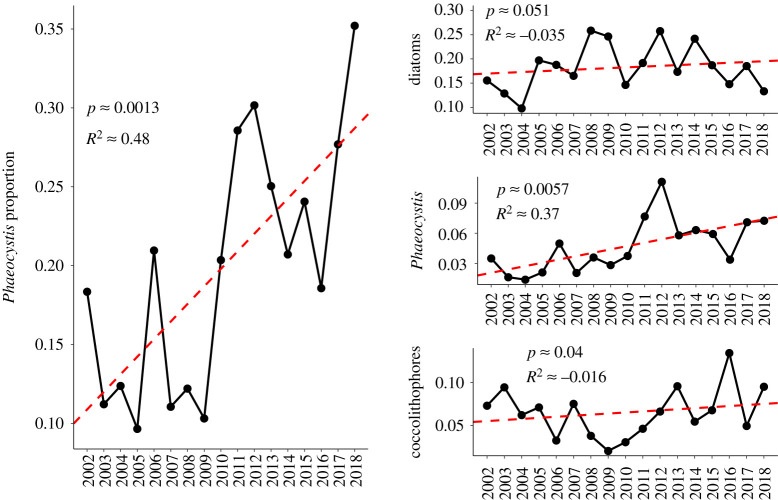
Figure 4.
Evolution of the dominance of different phytoplankton groups in the Barents Sea in July. Phaeocystis proportion is defined as the number of Phaeocystis classifications divided by the sum of diatom and Phaeocystis classifcations. All other subplots record the number of classifications of a specific phytoplankton group as a proportion of the total number of observations. Linear regressions with time are represented by red dashed lines. (Online version in colour.)

