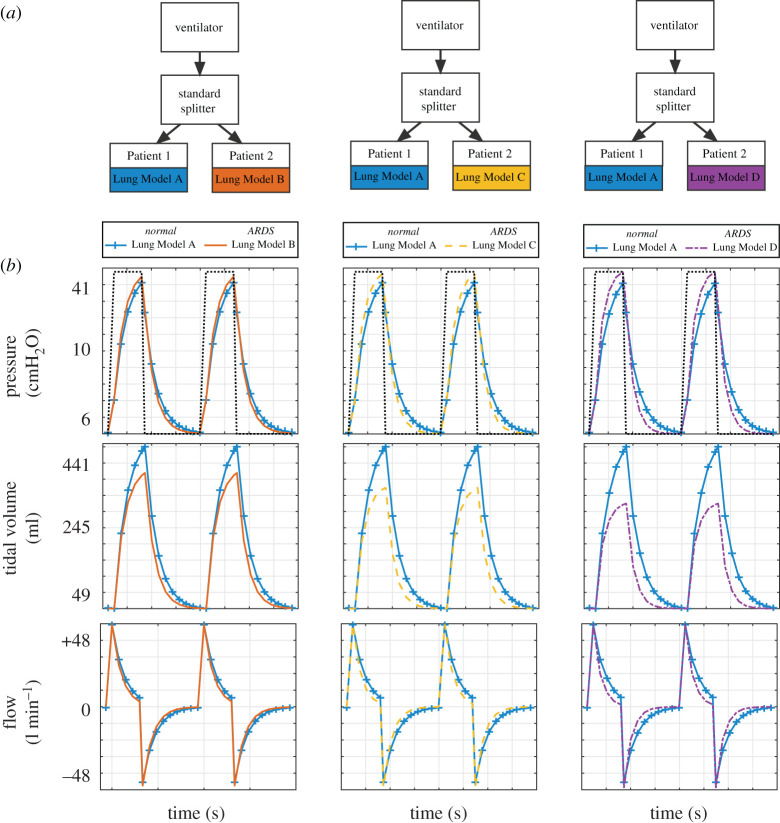
Figure 4.
Comparison of pressure–time, volume–time and flow–time curves for pairs of patients with dissimilar lung models. (a) In this experiment, two patients are connected via the standard splitter to the ventilator. For each simulation, patients in each pair were parametrized with mismatched lung models, i.e. Lung Model A + Lung Model B (left column); Lung Model A + Lung Model C (middle column); Lung Model A + Lung Model D (right column). (b) Ventilation was performed in pressure control mode with PIP 15cmH2O, PEEP 5 cmH2O, RR 15 breaths/min, I : E ratio 1 : 2 (dotted line, top panel). Pressure–time, tidal volume–time and flow–time graphs are shown in each panel for Patient 1 (blue) and Patient 2 (orange, yellow or purple). Note that tidal volume for Patient 2 decreases as lung compliance decreases while tidal volume for Patient 1 remains constant.

