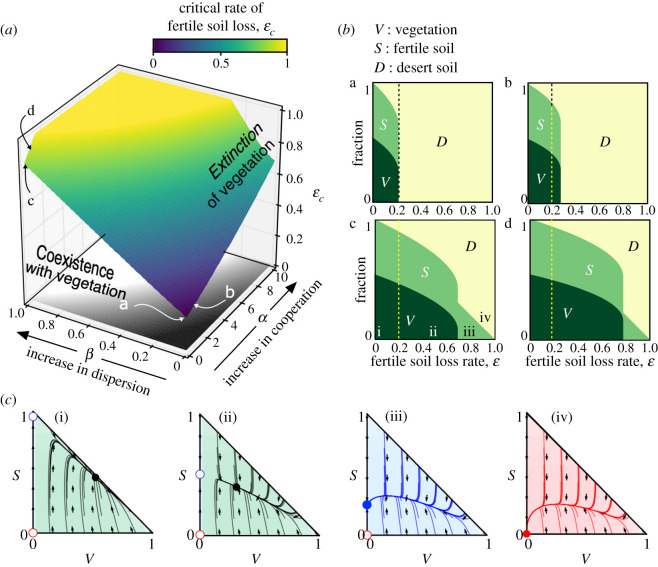
Figure 2.
Dynamics of the mean-field model for the non-terraformed ecosystem and the terraformed one. (a) Critical degradation rate of fertile soil (ɛc) computed in the parameter space of engineering strategies (α, β) from equations (3.5) and (3.6). The inner surface separates the values of ɛ allowing for the presence of vegetation. The yellow area indicates those pairs of α and β giving εc ≥ 1 (those values of ɛc > 1 are set to ɛc = 1). The region with no extinction of vegetation is also displayed projected on the ground of the plot (white zone). (b) Fraction of the states at equilibrium increasing ɛ and using a full vegetated system as initial conditions V(0) = 1, S(0) = D(0) = 0. (b.a) Results for a non-engineered ecosystem (α = β = 0), and (b.b) for the engineered ecosystem incorporating cooperation loops (α = 1 and β = 0). Finally, panels (b.c) and (b.d) display, respectively, the results engineering the resilience of the soil crust (α = 0 and β = 1) and both strategies (α = β = 1). The dashed vertical lines indicate the critical value of fertile soil loss obtained for the non-engineered system εc = 0.218 [19]. (c) Phase portraits for the case α = 0 and β = 1, with: (i) ɛ = 0.0; (ii) ɛ = 0.2; (iii) ɛ = 0.6; and (iv) ɛ = 0.9. The circles indicate the fixed points (stable: solid; unstable: open). We note that in the phase portraits (i) and (ii) there exists an interior saddle (see electronic supplementary material, figures S1–S4 for the identification of the nullclines and dynamics). Green, blue and red regions of the phase portraits denote the equilibrium states of V-S coexistence, S-D coexistence, and full desert, respectively. The other parameters are r = 0, f = 0.9, δ = 0.1, b = 0.6, c = 0.3 and m = 0.15.

