Figure 3.
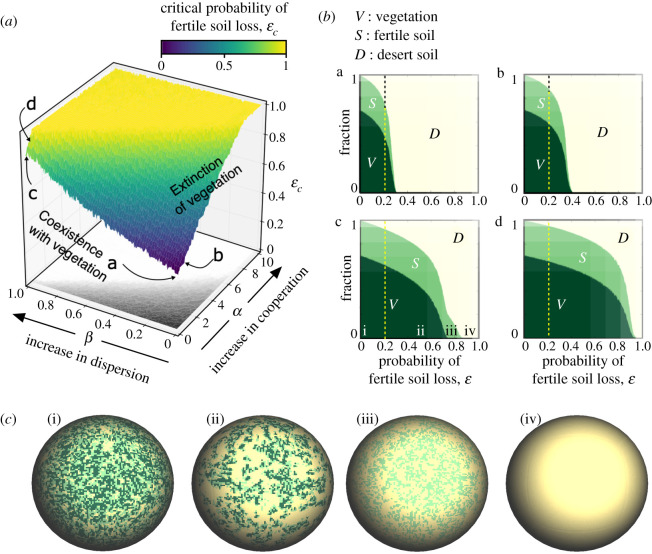
Dynamics of the spatial model (using a 200 × 200 sites lattice) with and without terraformation strategies (see figure 2 for comparison). (a) Vegetation extinction surface depending on the engineering strategies α and β. The yellow region indicates that vegetation extinction cannot be achieved because ɛ = 1 (this region is also projected on the ground of the plot (white zone)). (b) Bifurcation diagram using the probability of fertile soil loss ɛ for different engineering strategies (α β). Here, the dashed vertical lines also indicate the critical value of fertile soil loss obtained with the mean-field model for the non-engineered system, εc = 0.218 · · ·. (b.a) Non-engineered ecosystem (α = β = 0), (b.b) engineering of cooperative loops between synthetic microorganisms and the vegetation (α = 1 and β = 0), (b.c) engineering resilience of the soil crust (α = 0 and β = 1); and (b.d) engineering both terraformation strategies (α = β = 1). (c) Spatial patterns for the case α = 0 and β = 1 (panel (b.c) above) with: (i) ɛ = 0.00; (ii) ɛ = 0.55; (iii) ɛ = 0.75; and (iv) ɛ = 0.90. The probability values have been fixed as the parameters of figure 2, also with V(0) = 1.

