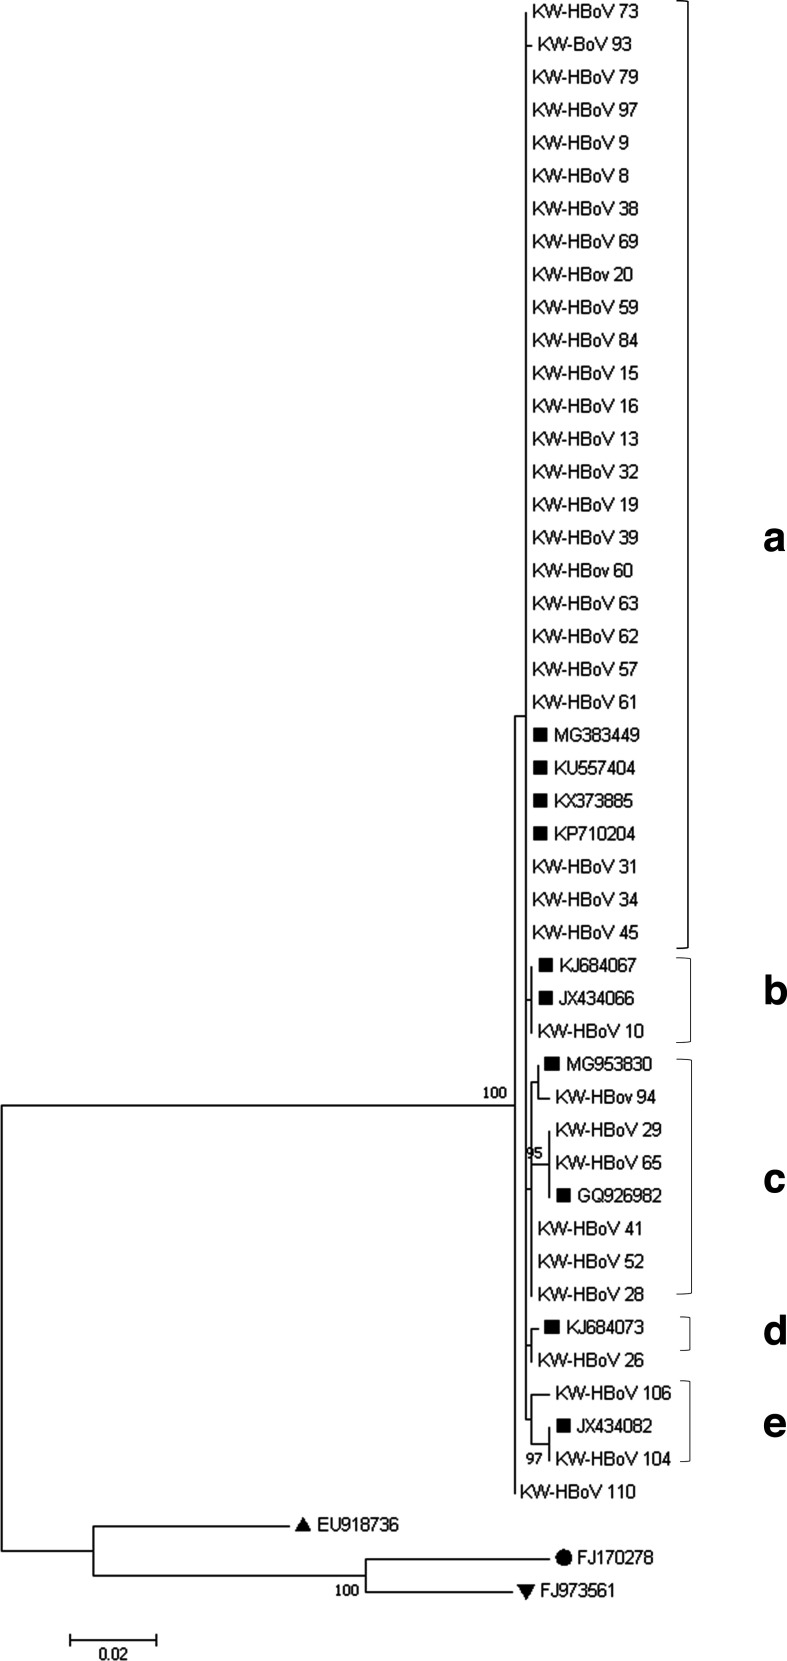
Fig. 3.
Phylogenetic analysis of partial sequences of the NP1 and VP1/VP2 genes (≈748) of 36 HBoV-1 isolates from patients. The topology tree was constructed using the maximum-likelihood method and mega 7.0. The stability of the tree was evaluated by using 1000 bootstrap replicates. Only bootstrap values greater than 70 % are shown on the branch. ■, HBoV-1 sequence from GenBank; ●, HBoV-2 sequence from GenBank; ▲, HBoV-3 sequence from GenBank and ▼, HBoV-4 sequence from GenBank.

