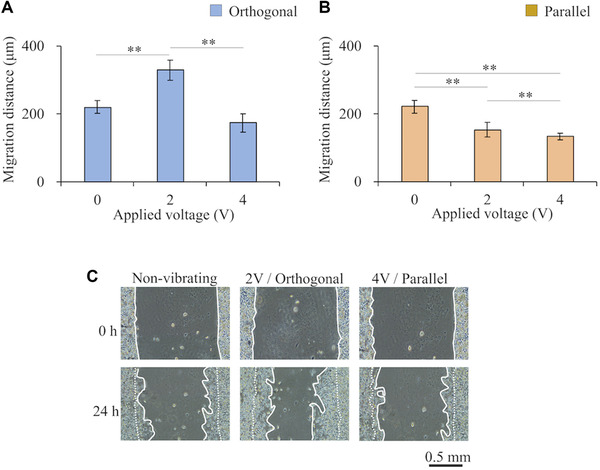
FIGURE 4.

Migration distance results: (A‐B) Migration distances when vibrational stimulation was applied (A) orthogonal to the gap and (B) parallel to the gap. (C) Cell migration over 24 h under three conditions; no vibration (referred to as “non‐vibrating”), vibration orthogonal to the gap with a voltage amplitude of 2 V (“2 V/Orthogonal”), vibration parallel to the gap with a voltage amplitude of 4 V (“4 V/Parallel”). The dashed and solid white lines represent the edges of the cell areas before and after migration. Data are presented as mean ± SD, **p < 0.01, n = 3
