
Figure 1.
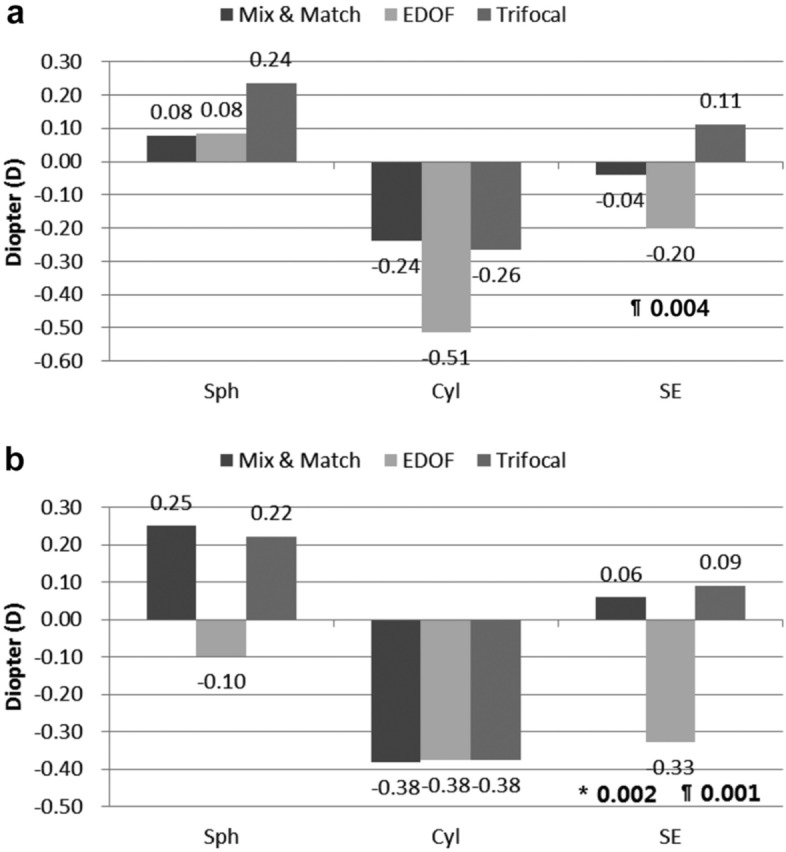
Postoperative refractive outcomes in the three groups (Mix-and-Match, EDOF and Trifocal). a Dominant eye. The EDOF group had significantly higher myopic SE values than did the Trifocal group (p = 0.004) in the dominant eyes at three months. b Non-dominant eye. The EDOF group had higher myopic SE values than did the Mix-and-Match group (p = 0.002) and the Trifocal group (p = 0.001) in non-dominant eyes at three months. All outcomes were compared among the three groups. Bonferroni correction for multiple comparisons: significant p values (p < 0.017) in bold with symbols. *: Mix and Match versus EDOF, §: Mix and Match versus Trifocal, ¶: EDOF versus Trifocal.