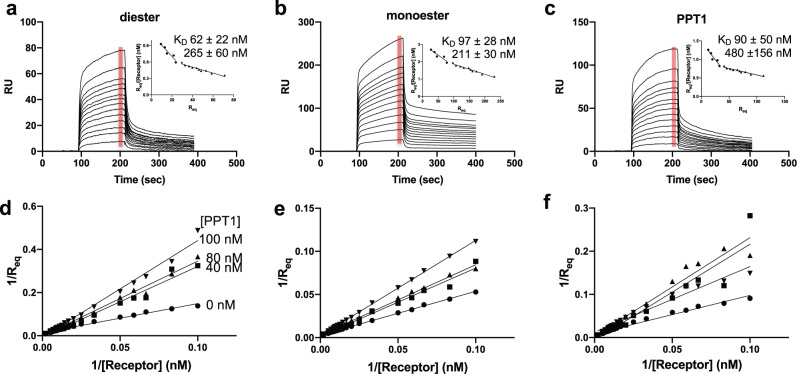
Fig. 4. Ligand binding properties of domains 1–5 as assessed by SPR.
Sensorgrams of domains 1–5 truncated protein (10, 15, 20, 30, 40, 50, 60, 70, 80, 90, 100, 110, and 120 nM) flowing over GAA-phosphomonoester (a) or GAA phosphodiester (b) and PPT1 (c) surfaces. Inset graphs show Scatchard plots based on average RU value collected over 10-s time intervals at the end of the association phase for each concentration of domains 1–5 (red bar). The calculated KDs (−1/slope) values for two binding events are listed and n = 4 independent experiments (standard error of mean is reported). Results from the accompanying competitive inhibition study are displayed as double reciprocal plots (d–f) in which domains 1–5 protein (at 10, 15, 20, 30, 40, 50, 60, 70, 80, 90, 100, 110 or 120 nM concentration) was preincubated for 2 h with 0, 40, 80, or 100-nM PPT1 (as indicated in d) before being flowed over the three different lysosomal enzyme surfaces as indicated in a–c.

