
Fig. 6. Possible secondary site of oligosaccharide interaction.
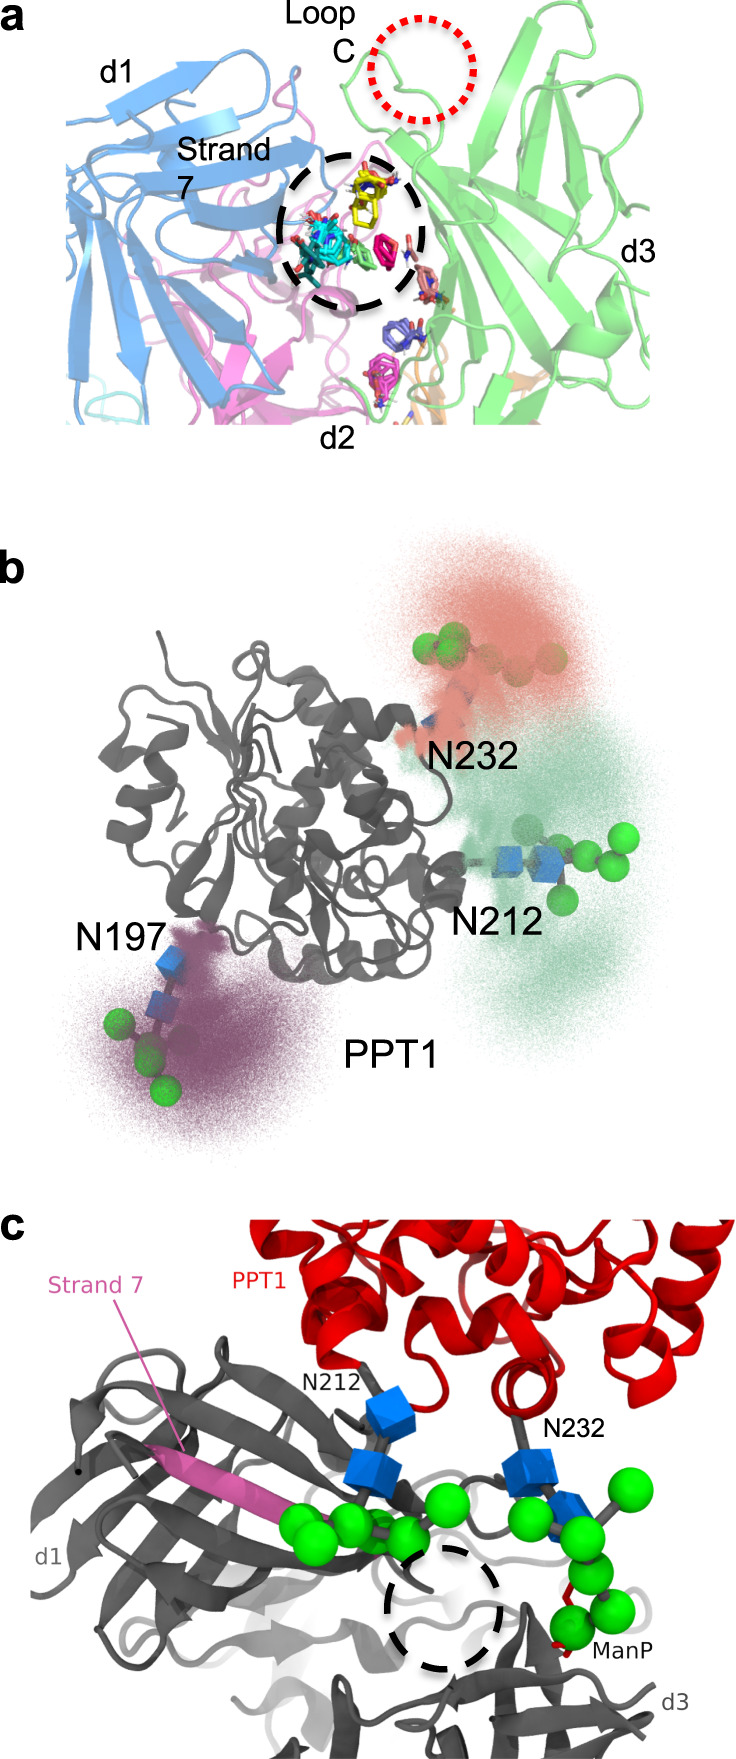
a Small molecule “hot spots” identified through the use of the FTMap server (http://ftmap.bu.edu/login.php) are shown (colored stick representation) on the model of domains 1–5 bound to a ligand in domain 3. Region of predicted small molecule interaction near secondary site proposed from analysis of FPOP data is circled in dashed black line. Loop C of the M6P binding site (circled in dashed red line) is labeled (domains are colored d1, blue; d2, magenta; d3, green). b Molecular dynamics simulations were used to map the extent of movement the 3 N-linked glycans of PPT1 can undergo (mannose moieties are represented by green spheres while blue boxes are used to represent GlcNAc). c PPT1 (PDB 1EI9) (red) structure is overlaid on the model of domains 1–5 (dark gray) with domain 3 bound and domain 5 in the unbound position with the oligosaccharide on N232 of PPT1 resting near Loop C (binding site) of domain 3. The oligosaccharide on N212 of PPT1 is located near strand 7 (magenta) of domain 1. Small molecule “hot spots” are circled in dashed black line. Mannose moieties are represented by green spheres while blue boxes are used to represent GlcNAc.