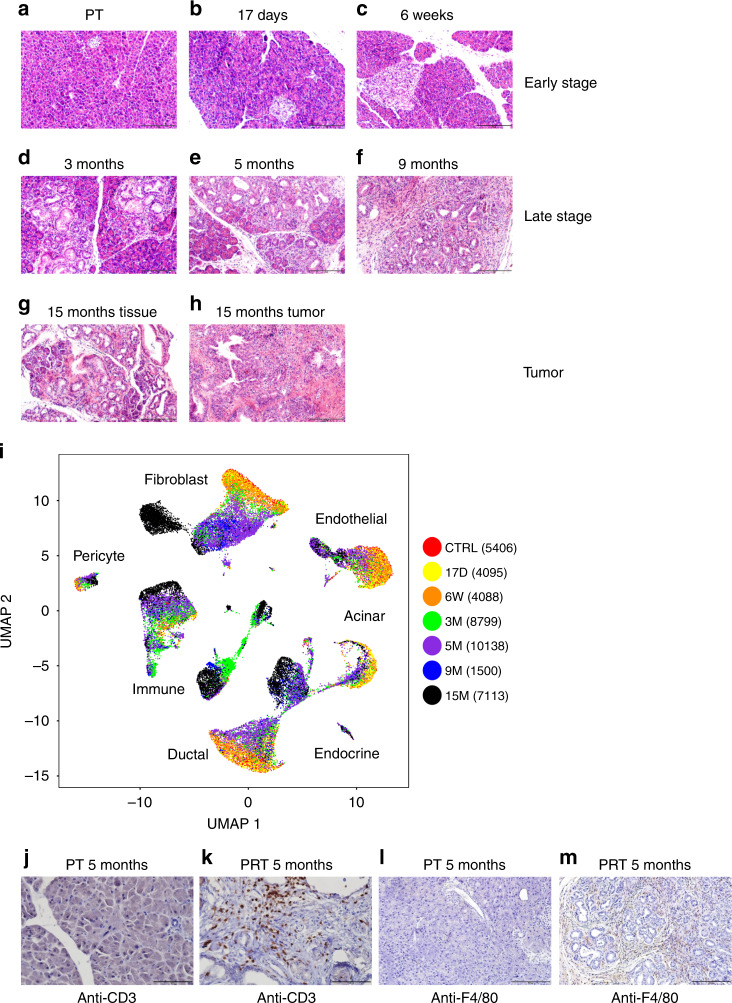
Fig. 1. Single-cell RNA-seq experiment of pancreatic tissue, taken from Ptf1a-CreER, LSL-Kras G12D, LSL-tdTomato mice at different time points post-tamoxifen injection (PTI).
a–h The accumulation of duct-like structures and PanINs at different time points post-tamoxifen injection (PTI). Hematoxylin and Eosin (H&E) staining of histological sections of mice pancreas. The time point PTI is indicated above each panel. Based on the number of PanINs and duct-like structures (quantification in Supplementary Fig. 1a), we define early stage, late-stage and tumor sample. g, h Two sections from the same mice, g tumor adjacent tissue, and h tumor tissue. In early stage samples, lesions were rare. Scale bars 200 µm. i Pancreatic tissues from mice were dissected and single-cell RNA-seq experiments were performed. Uniform manifold approximation and projection (Umap) includes all cells from seven different time points PTI. The data were produced from nine mice, two mice from 3 months PTI, two mice from 5 months PTI and one mouse from each of the other time points. Time points are indicated on the right side of the panel, the number of cells is shown in parentheses. Cell types were determined based on the expression level of representative markers as indicated in Supplementary Fig. 1. j, k Immunostaining of pancreatic sections using anti-CD3 antibody. Both sections were taken from five months PTI mice, j control mouse Ptf1a-CreER, LSL-tdTomato (PT), k Ptf1a-CreER, LSL-Kras G12D, LSL-tdTomato (PRT) mouse. Scale bars 100 µm. l, m Immunostaining of pancreatic section using anti-F4/80 antibody. Both sections were taken from 5 months PTI mice, l control mouse Ptf1a-CreER, LSL-tdTomato (PT), m Ptf1a-CreER, LSL-Kras G12D, LSL-tdTomato (PRT) mouse. Scale bars 200 µm.

