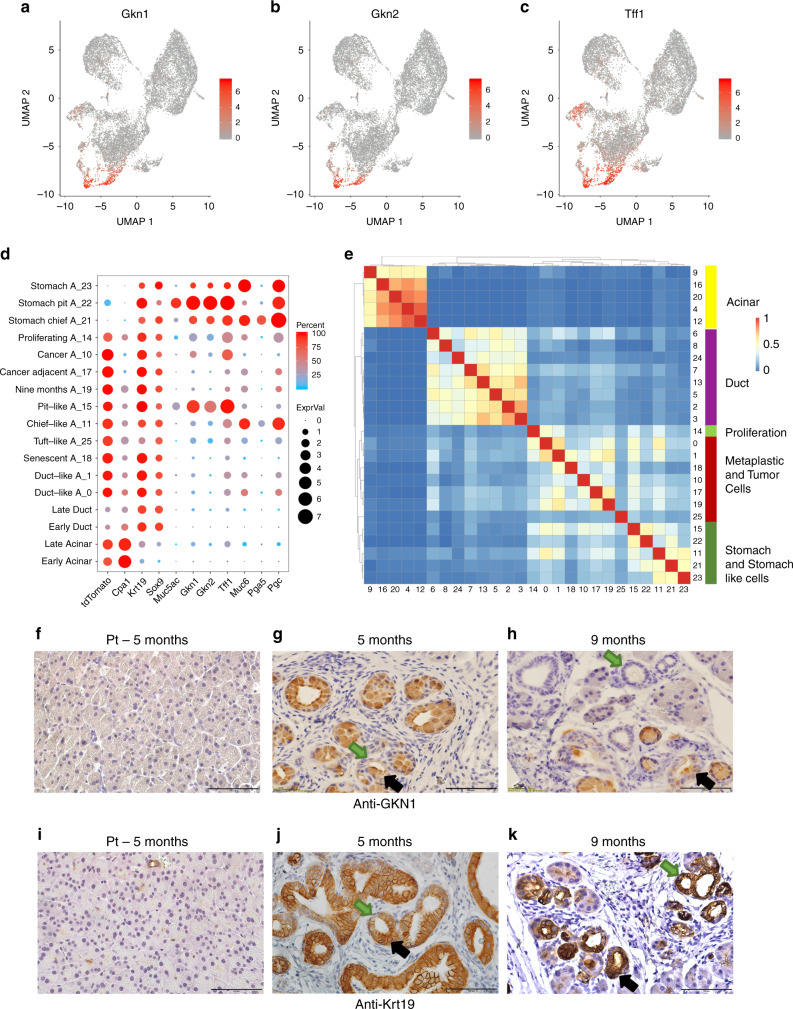
Fig. 3. A subset of metaplastic cells express overlapping sets of genes with stomach pit cells, and are localized to PanINs.
a–c UMAP showing the expression level of highly expressed genes in cluster A_15 cells that we found to include Pit-like cells. In each chart, the expression level of one gene is indicated, a Gkn1, b Gkn2, and c Tff1. High expression level—red, low expression level —gray. Scale is on the right and relevant gene name on the top of each chart. d Dot plot showing the expression level of sets of genes (x-axis) in different subsets of cells (y-axis). Subsets of cells are based on the clusters in Fig. 2b early acinar/ductal cells (control, 17 days and 6 weeks PTI samples), late (3, 5, and 9 months PTI samples). The average expression level is shown by the size of the dot and the percentage of cells that express the relevant gene is indicated by the color. e Distances matrix of all clusters of acinar, ductal, metaplastic, and stomach epithelial cells shown in Fig. 2b. Cluster numbers are indicated on the bottom and on the right, clusters were ordered based on the hierarchical clustering analysis. The scale score of overlapping genes is shown in the red-blue bar. The cell types and cell lineages are indicated on the bar color on the right. Genes used for this analysis are based on comparing the expressed genes in the relevant cluster to all the cells shown in Fig. 1 (see “Methods”). f–k Histological sections of mice pancreas. f, i PT control mice, g, j five months PRT, h, k nine months PRT. f–h Staining with anti-Gkn1, i–k staining with anti-Krt19. Black arrows indicate representative cells that are large and therefore may contain mucins, green arrows indicate representative cells that are smaller and without mucins. Scale bars 100 µm.

