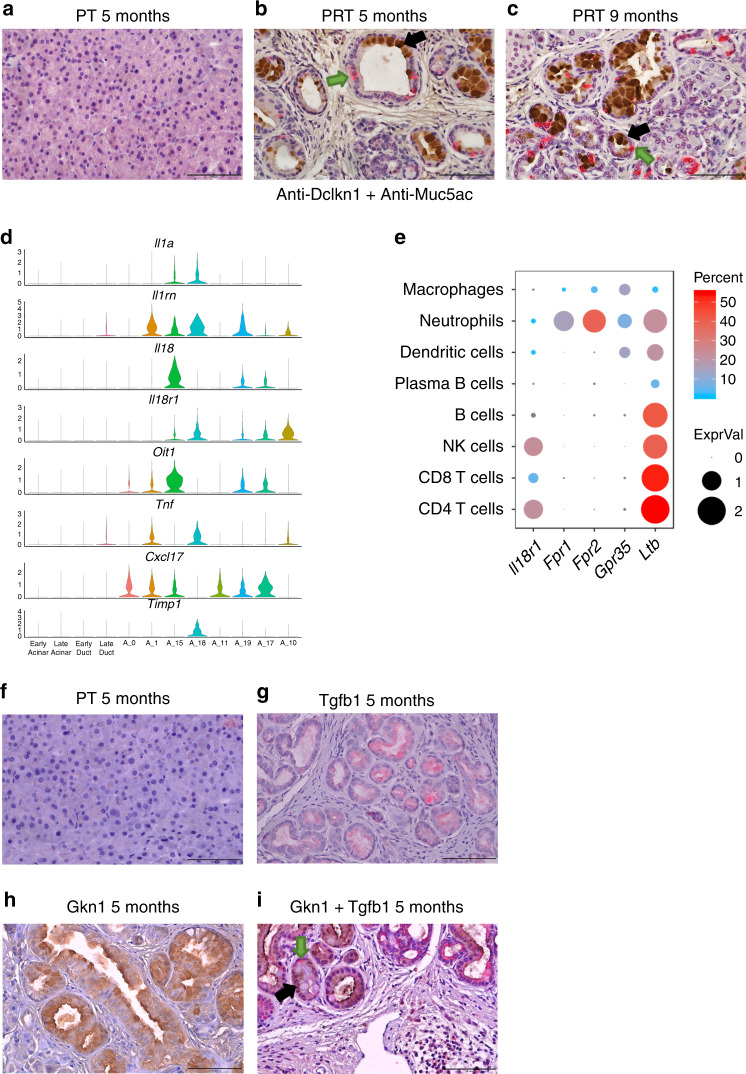
Fig. 5. Potential metaplastic cell–cell interactions and co-localization of different metaplastic cell types to the same PanINs.
a–c Immunostaining of histological sections with anti-Dclk1 (red) and anti-Muc5ac (brown) antibodies. Arrows mark representative cells in the PanINs that stained positive with anti-Dclk1 (green arrow) or with anti-Muc5ac (black arrow). a Section taken from control, 5 months PT mouse, b section taken from 5 months PRT mouse, c section taken from 9 months PRT mouse. Scale bars 100 µm. d Violin plot showing the expression level (normalized expression) of a selected set of secreted molecules and receptors. On the x-axis: Early acinar/ductal cells (control, 17 days and 6 weeks PTI samples), late (all other time points), and clusters of metaplastic cells. e Dot plot showing the expression of a set of receptors (x-axis) across the different subset of immune cells (y-axis). Immune cells subtypes are determined based on data presented in Fig. 7. The average expression level is shown by the size of the dot and the percentage of cells is indicated by the color. f, i Immunostaining of histological sections of the pancreas, double stain with anti-Tgfb1 (red) and with anti-Gkn1 (brown), representative cell marked with arrows, anti-Tgfb1 (green arrow), and anti-Gkn1 (black arrow), f control, 5 months PT mouse, i 5 months PRT mouse. g 5 months PRT mouse section, stained with anti-Tgfb1, h 5 months PRT mouse section, stained with anti-Gkn1. i. Scale bars 100 µm.

