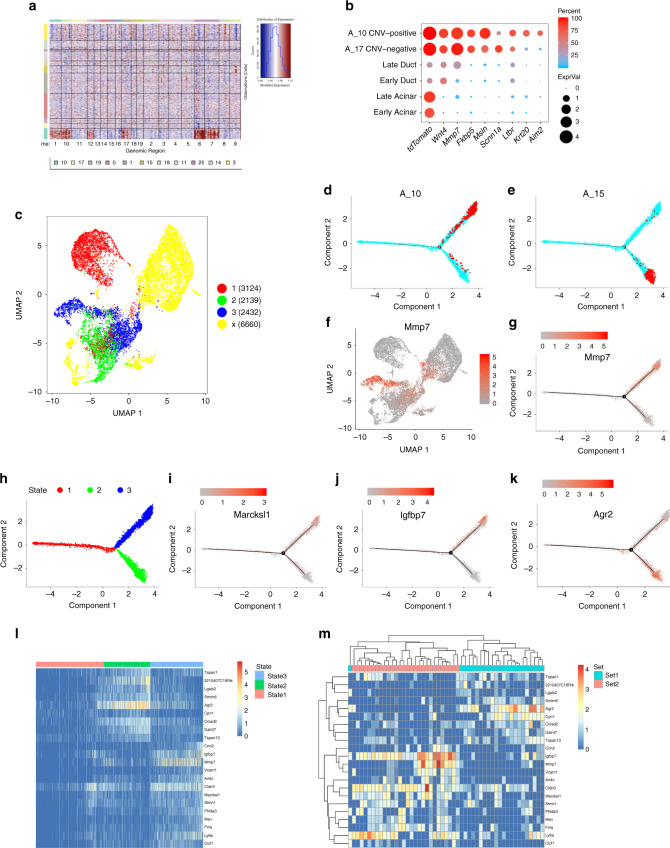
Fig. 6. Characterization of changes in metaplastic and tumor cells gene expression.
a CNV analysis of tdTomato-positive cells. On the x-axis mouse chromosome regions, on the y-axis clusters numbers. The copy number variation score is indicated on the right. b Dot plot showing the expression of a set of genes that are differentially expressed between normal acinar and ductal cells, and tumor cells (clusters A_17 and A_10). c Trajectory analysis of acinar ductal metaplastic and stomach epithelial cells colored according to states. The states are shown on the right, cells in yellow were not considered in the trajectory analysis. Numbers of cells are in parentheses. The figure shows that acinar cells can process to two different stages. d, e Trajectory charts showing: A_15 cluster cells (metaplastic pit-like cells) in red (d), and A_10 cluster cells (cancer cells) in red (e), all the other cells in the analysis in turquoise. f UMAP showing the expression level of Mmp7. Red—high expression; gray-low expression. g Trajectory chart showing the expression level of Mmp7. h Trajectory chart including the different stages. Coloring matches the colors in panel c and indicated above the panel. i–k Trajectory chart showing the expression level of i Marcksl1, j Igfbp7, k Agr2. Marcksl1 and Igfbp7 express in acinar cells and cells in state 3, Agr2 expresses in acinar cells and cells in state 2. Red-high expression; gray-low expression. l Heatmap includes the differentially expressed genes between states 2 and 3. Differentially expressed genes were included if they expressed in cells from cluster A_9. Order of genes similar to the order in panel m. Cells from trajectory analysis included and ordered based on their state. m Heatmap showing the same differentially expressed genes as in panel l, genes and cells ordered by hierarchical clustering. Only cells from cluster A_9 were included.

