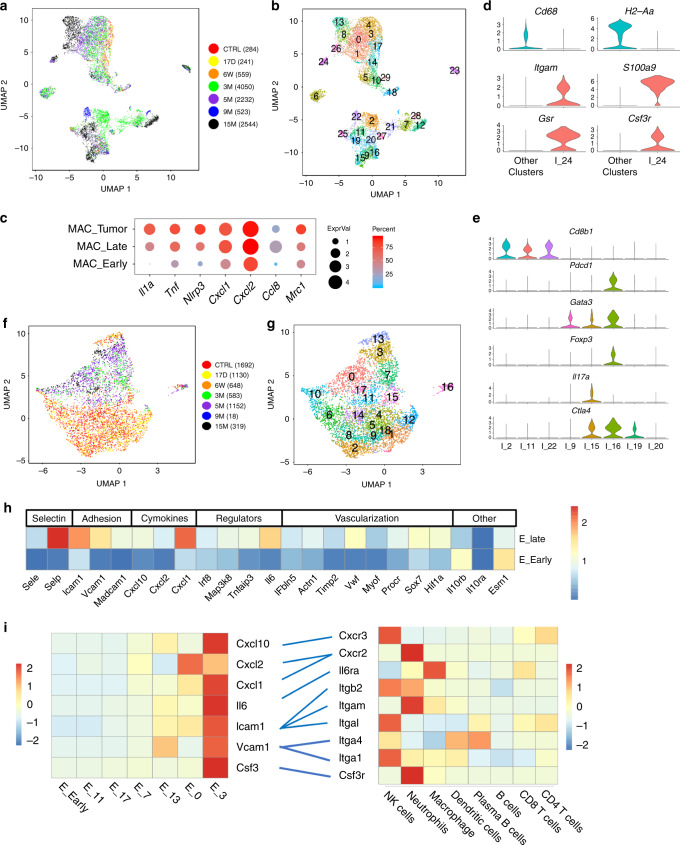
Fig. 7. Immune cell and endothelial cell heterogeneity.
a UMAP including CD45-positive cells. Time points post-tamoxifen injection (PTI) and cell numbers are presented on the right. b The same UMAP as in (a), the number of each cluster is indicated. c Dot plot of selected differentially expressed genes in macrophages; in early time point PTI, late time point PTI and tumor-associated macrophages. Dot size represents the scaled expression level and color represents the percentage of expressed cells. d Violin plot of cells in cluster I_24 (which we identify as neutrophils) and cells from all other CD45-positive clusters. Markers of macrophages and neutrophils are shown. Expression levels on the y-axis—normalized expression. e Violin plot showing the expression level of selected genes that are expressed in CD3-positive cells. Clusters I_2, I_11, and I_22 include CD8-positive T cells. Clusters I_9, I_15, I_16, I_19, I_20, include CD4-positive T cells. f UMAP includes CD31-positive cells. Time points post-tamoxifen injection and cell numbers are presented on the right. g The same UMAP as in (f), the number of each cluster is indicated. h The average expression level of selected differentially expressed genes of endothelial cells, between early time point PTI and late time point. Expression scale is indicated on the right and gene annotation on the top. i Potential interactions between endothelial cells and immune cells. Scaled gene expression of selected adhesion molecules, cytokines and chemokines and their matched receptors are shown. Blue lines show the potential interactions. Left heat map includes endothelial scaled expressed genes as indicated in endothelial cells clusters. Average of all the early time point PTI clusters or individual late time point PTI clusters as listed on the bottom. Right heat map includes expression levels of genes that encode matched receptors in immune cells as indicated on the bottom. Red - high expression, blue - low expression (see bars).

