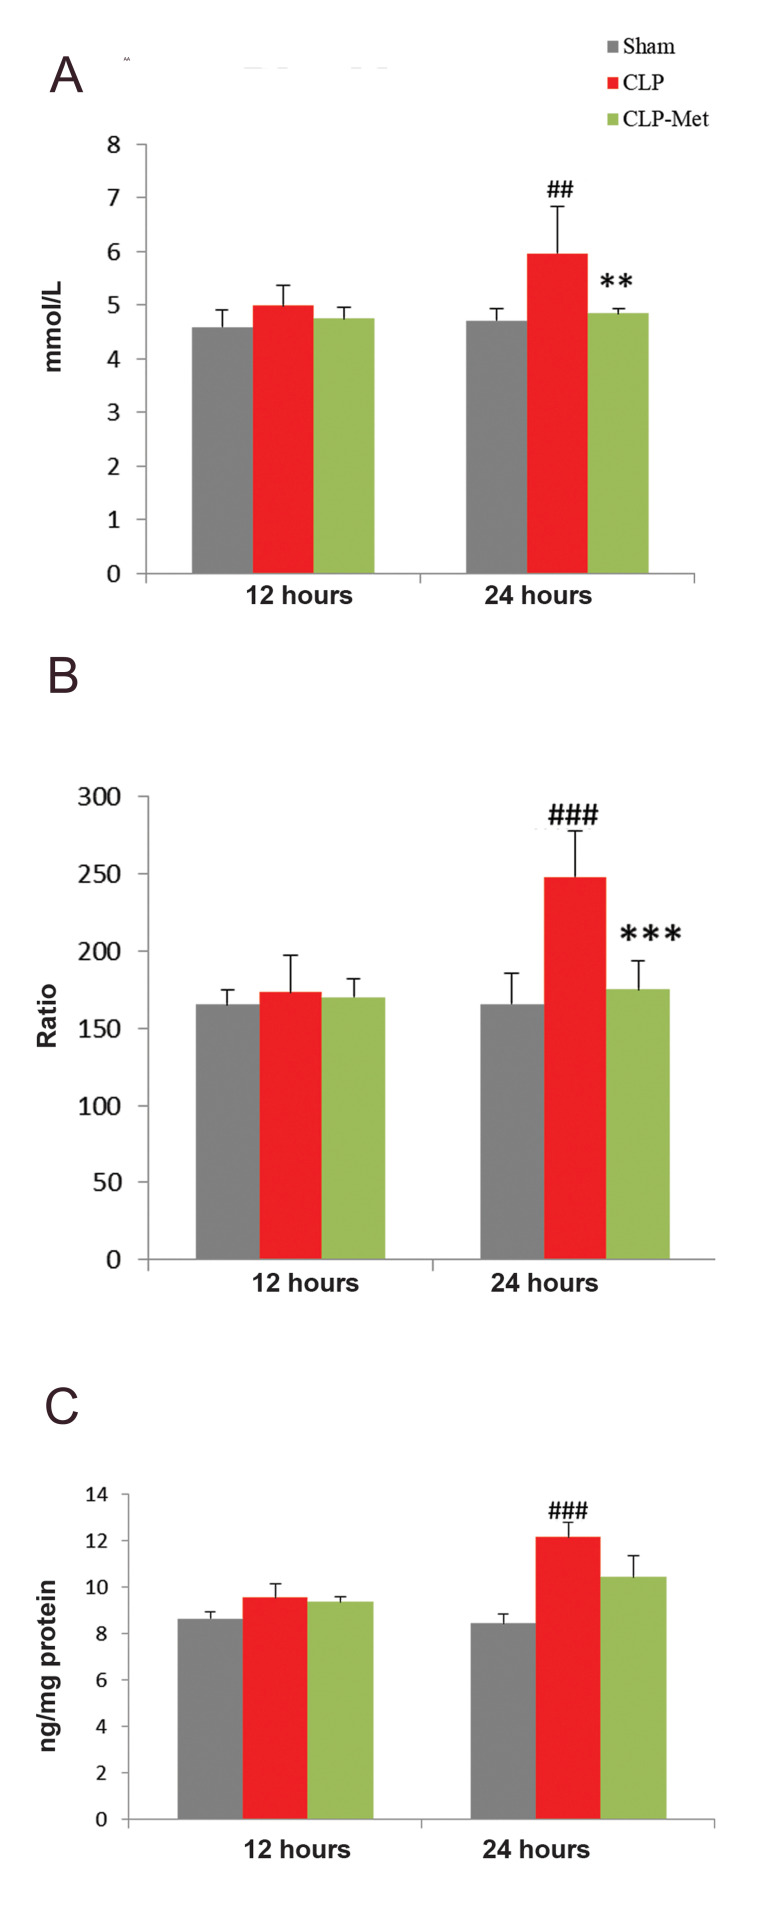
Fig.2.
Effect of metformin administration on blood lactate and HMGB1 levels and PLR. A. CLP increased blood lactate, B. PLR, and C. HMGB1 in rats. Values are expressed as mean ± SD, n= 6. Statistical evaluation of results using oneway ANOVA revealed a significant difference among the groups for blood lactate levels (P<0.001), PLR (P<0.001), HMGB1 (P<0.001).
PLR; Platelet lymphocyte ratio, CLP; Cecal ligation and puncture, ##; P<0.01, ###; P<0.001 as CLP compared with sham, **; P<0.01, and ***; P<0.001 between metformin-treated group and the CLP.

