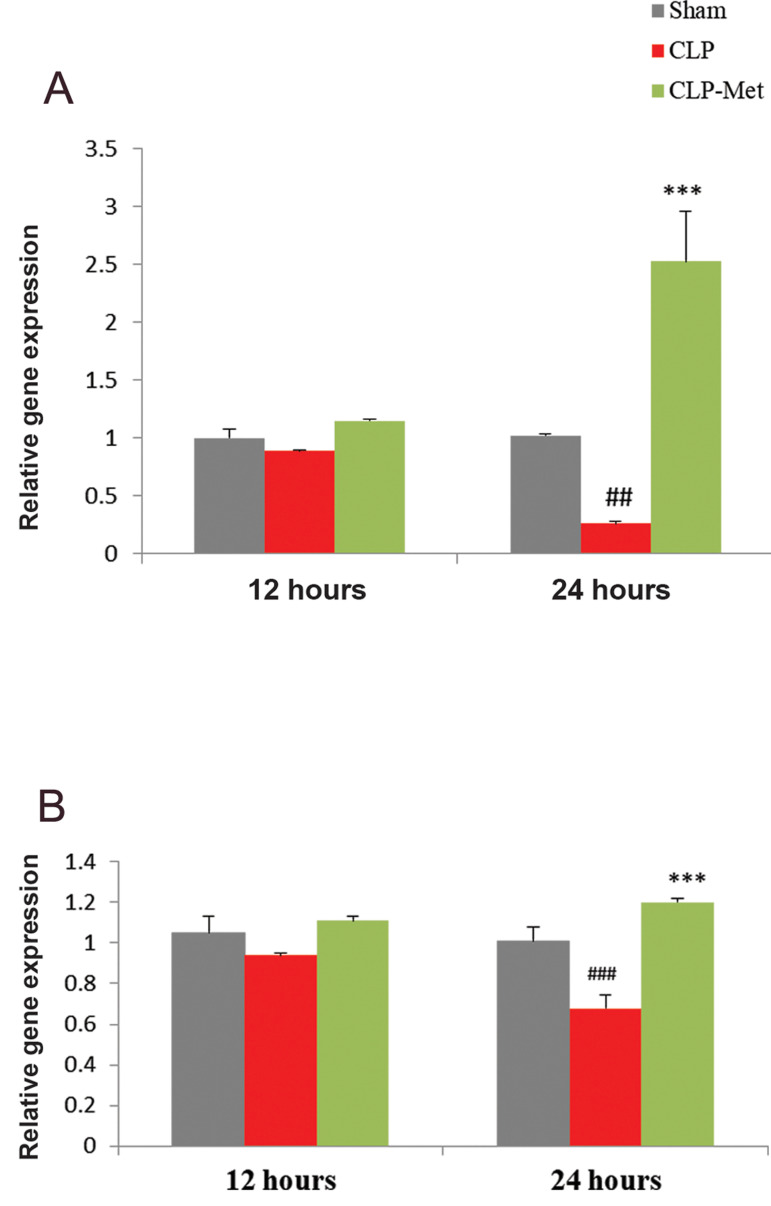
Fig.3.
Effect of metformin administration on Cldn3 and Cldn5 gene expressions. CLP decreased A. Cldn3 and B. Cldn5 expression in rats. Values are expressed as mean ± SD. Statistical evaluation of results using one-way ANOVA, revealed a significant difference between groups for Cldn3 (P<0.001), and Cldn5 (P<0.001).
CLP; Cecal ligation and puncture, ##; P<0.01, ###; P<0.001 as CLP compared with sham, and ***; P<0.001 between metformin-treated group and CLP.

