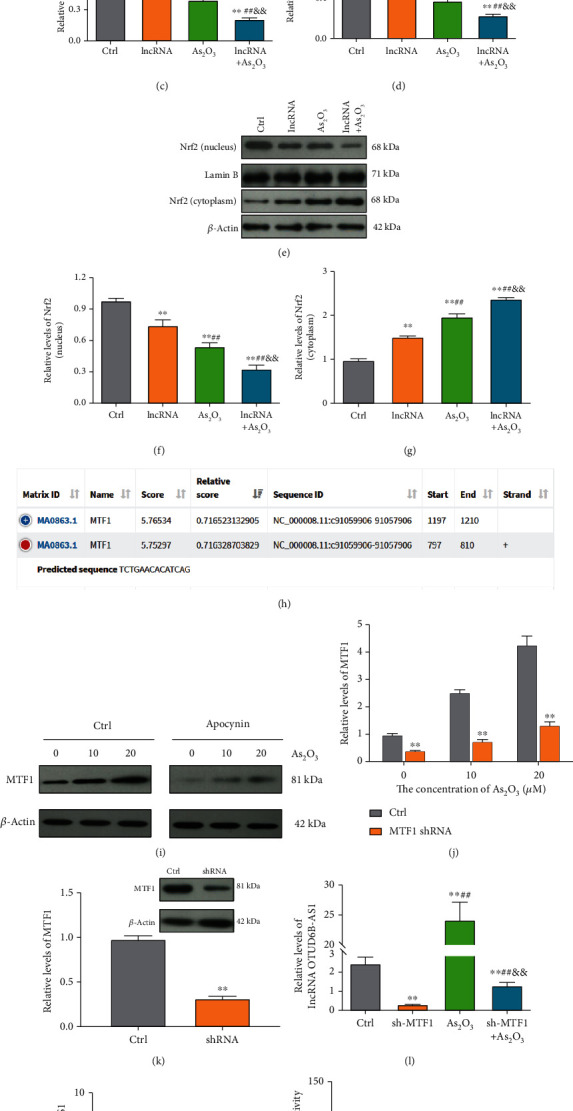
Figure 3.

Transcription of lncRNA OTUD6B-AS1 was activated by As2O3 through upregulation of MTF1. (a–d) ROS, MDA, SOD, and GSH-Px production in bladder cancer cells following lncRNA OTUD6B-AS1 overexpression or treatment with 20 μmol/L As2O3. ∗P < 0.05, ∗∗P < 0.01 vs. control cells; #P < 0.05, ##P < 0.01 vs. cells with lncRNA OTUD6B-AS1 overexpression; &P < 0.05, &&P < 0.01 vs. cells treated with 20 μmol/L As2O3. (e–g) Nrf2 expression in cytoplasm and nucleus following lncRNA OTUD6B-AS1 overexpression or treatment with 20 μmol/L As2O3. ∗P < 0.05, ∗∗P < 0.01 vs. control cells; #P < 0.05, ##P < 0.01 vs. cells with lncRNA OTUD6B-AS1 overexpression; &P < 0.05, &&P < 0.01 vs. cells treated with 20 μmol/L As2O3. (h) The MTF1 binding site in the lncRNA OTUD6B-AS1 promoter predicted using the JASPAR database. (i) MTF1 expression in bladder cells in response to different concentrations of As2O3, pretreated with or without apocynin at 20 μm for 1 h, was analyzed by Western blotting. (j) Statistical analysis of MTF1 expression. ∗P < 0.05, ∗∗P < 0.01 vs. control cells. (k) MTF1 expression was detected by Western blotting following MTF1 knockdown. ∗P < 0.05, ∗∗P < 0.01 vs. control cells. (l) Measurement of lncRNA OTUD6B-AS1 levels in bladder cells by qRT-PCR following MTF1 knockdown or treatment with 20 μmol/L As2O3. ∗P < 0.05, ∗∗P < 0.01 vs. control cells; #P < 0.05, ##P < 0.01 vs. cells with MTF1 knockdown; &P < 0.05, &&P < 0.01 vs. cells treated with 20 μmol/L As2O3. (m) Chromatin immunoprecipitation assay using an MTF1 antibody to pull down the indicated lncRNA OTUD6B-AS1 promoter sequence, followed by qRT-PCR analysis. ∗P < 0.05, ∗∗P < 0.01 vs. IgG. (n) Activation of transcription from the lncRNA OTUD6B-AS1 promoter by MTF1 determined by dual-luciferase reporter assay. ∗P < 0.05, ∗∗P < 0.01 vs. the control group.
