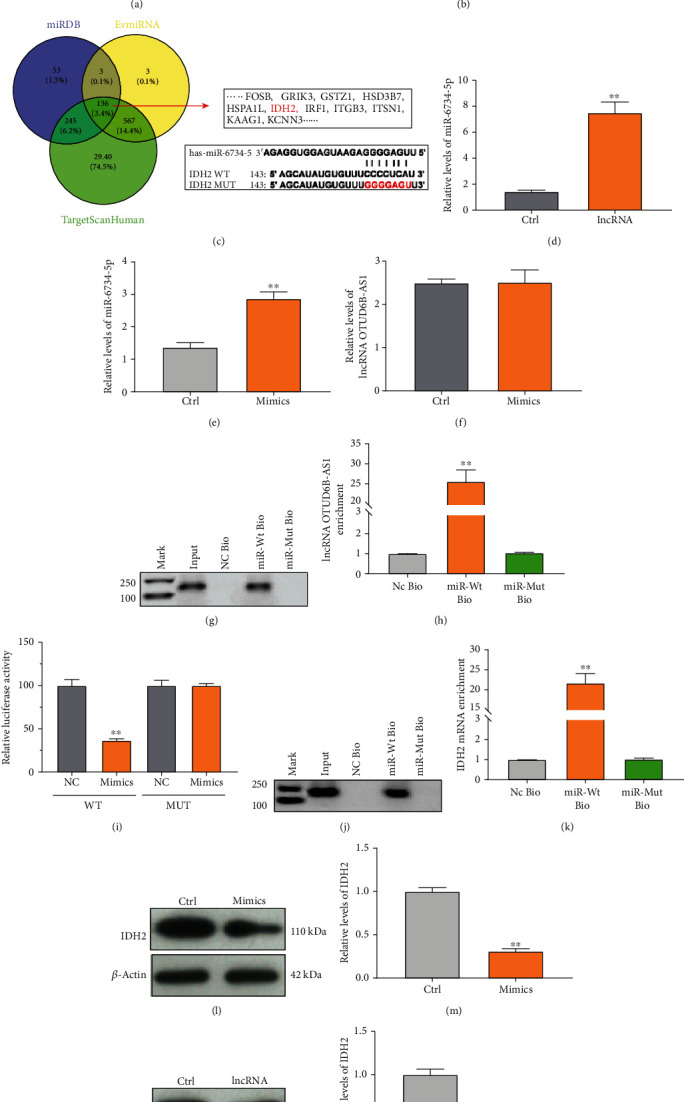
Figure 4.

lncRNA OTUD6B-AS1 regulates IDH2 expression via miR-6734-5p. (a) lncRNA OTUD6B-AS1 expression was detected in the cytoplasm or nucleus of bladder cells by qRT-PCR. U6 and GAPDH were used as nuclear and cytoplasmic controls, respectively. (b) miR-6734-5p binding sites in lncRNA OTUD6B-AS1 predicted by miRDB. (c) miR-6734-5p binding sites in the IDH2 mRNA 3′UTR predicted using TargetScanHuman, miRDB, and EVmiRNA. (d) Expression of miR-6734-5p in T24 bladder cancer cells, with or without lncRNA OTUD6B-AS1 expression, measured by qRT-PCR. ∗P < 0.05, ∗∗P < 0.01 vs. control cells. (e) miR-6734-5p expression in T24 cells, with or without transfection of mimics, measured by qRT-PCR. ∗P < 0.05, ∗∗P < 0.01 vs. control cells. (f) lncRNA OTUD6B-AS1 expression in T24 cells, with or without transfection of mimics, measured by qRT-PCR. ∗P < 0.05, ∗∗P < 0.01 vs. control cells. (g, h) Analysis of lncRNA OTUD6B-AS1 levels by qRT-PCR following biotin-based pull-down assays. ∗P < 0.05, ∗∗P < 0.01 vs. NC Bio. (i) Activity from luciferase reporter constructs treated with miRNA NC or miR-6734-5p mimics, along with WT or MUT IDH2 3′UTR. ∗P < 0.05, ∗∗P < 0.01 vs. miRNA NC. (j, k) Analysis of IDH2 mRNA levels by qRT-PCR following a biotin-based pull-down assay. ∗P < 0.05, ∗∗P < 0.01 vs. NC Bio. (l, m) IDH2 expression in bladder cells, with or without transfection of mimics, detected by Western blotting assay. ∗P < 0.05, ∗∗P < 0.01 vs. control cells. (n, o) IDH2 expression in bladder cells, with or without lncRNA OTUD6B-AS1 overexpression, detected by Western blotting assay. ∗P < 0.05, ∗∗P < 0.01 vs. control cells.
