Figure 3.

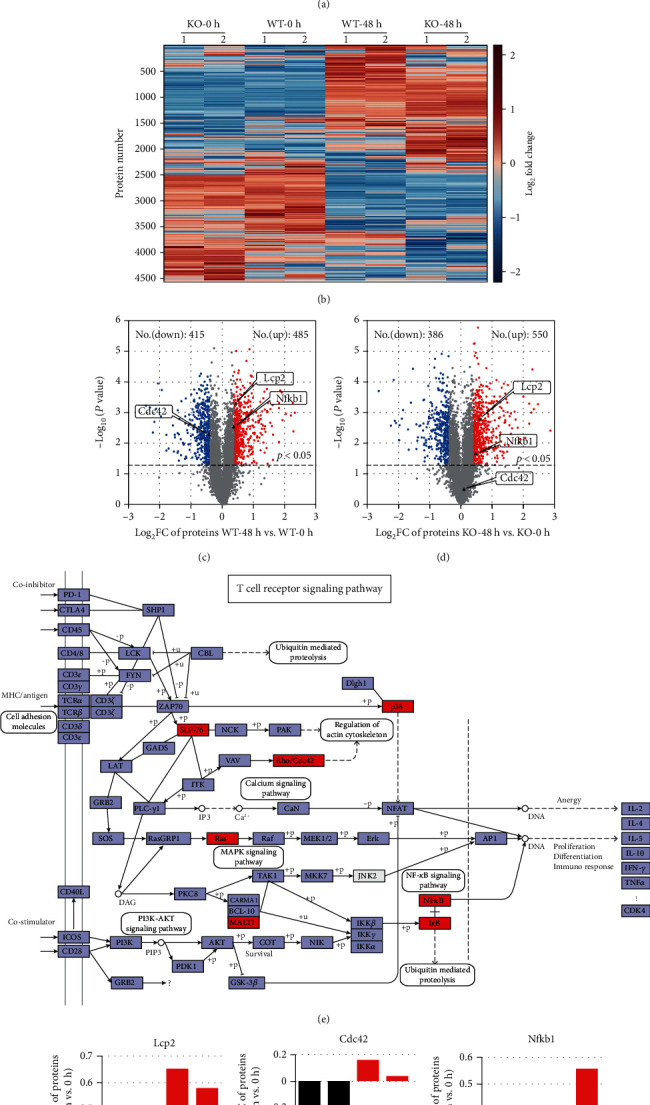
Proteomic changes following activation of mouse naive T cells from WT and Sirt5 KO mice. (a) Scheme of experimental design. Mouse naïve T cells were purified from spleens of WT/KO mice. Half of purified naïve T cells were collected directly. The other half were stimulated with anti-CD3/CD28 and harvested at 48 h postactivation. Then, 4-plexed iTRAQ and LC-MS/MS approaches were performed to quantify the proteome of T cells. (b) Heatmap showing the kinetics of proteome changes in naïve T cells (0 h) and activated T cells (48 h) from WT and KO mice. Data were from one experiment, and each group contained 2 technological replicates. (c, d) Volcano plot of differentially expressed proteins from WT (c) and KO (d) T cells. x-axis, Log2FC (48 h vs. 0 h); y-axis, -Log10(p value). Each point represents an individual protein. Upregulated proteins (p value < 0.05, fold change (FC) > 1.30) are shown in red, and downregulated proteins (p value < 0.05, FC < 0.77) are shown in blue. (e) T cell receptor signaling pathway (modified from reference pathway ko04660 in KEGG database). (f–l) FC (48 h vs. 0 h) of the selected proteins of WT and KO T cells. These selected proteins were annotated in red in (e).
