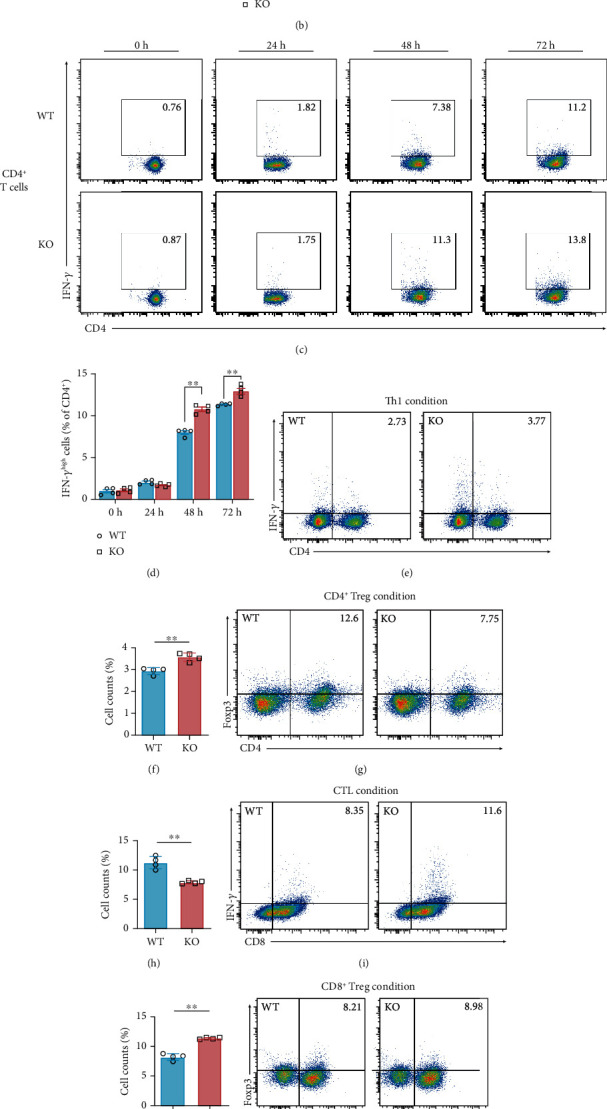
Figure 5.

IFN-γ production is promoted in Sirt5 KO activated T cells. (a, b) Representative flow cytometry (a) and percentage (b) of IFN-γhighCD8+ T cells activated for 0 h, 24 h, 48 h, and 72 h. (c, d) Representative flow cytometry (c) and percentage (d) of IFN-γhighCD4+ T cells activated for 0 h, 24 h, 48 h, and 72 h. (e, f) Representative flow cytometry (e) and percentage (f) of the proportions of Th1 cells (CD4+IFN-γ+) induced from naive T cells from WT/KO mice. (g, h) Representative flow cytometry (g) and percentage (h) of the proportions of CD4+ Treg cells (CD4+Foxp3+). (i, j) Representative flow cytometry (i) and percentage (j) of the proportions of CTLs (CD8+IFN-γ+). (k, l) Representative flow cytometry (k) and percentage (l) of the proportions of CD8+ Treg cells (CD8+Foxp3+). (m) Level of IFN-γ in the supernatant of WT and Sirt5 KO T cells activated for 48 h. (n) Cell viability of colorectal cancer cells (CT26.WT) cultured for 24 h in medium supplemented with murine recombinant IFN-γ. Data were from four or five independent experiments. The data are expressed as the mean ± SEM. ∗p < 0.05; ∗∗p < 0.01; n.s.: not significant; two-tailed unpaired t-test.
