Figure 3.

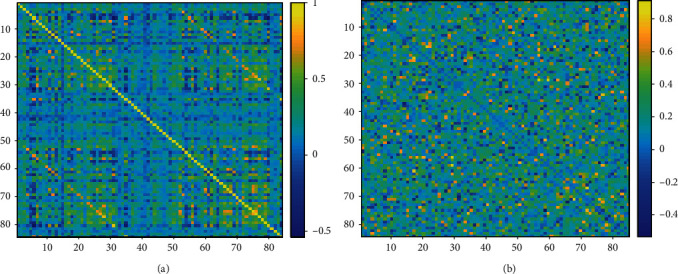
Functional connectivity matrix of real network (a) and randomized network (b) calculated in a random patient. The colorbar indicates the strength of connectivity between brain parcels.

Functional connectivity matrix of real network (a) and randomized network (b) calculated in a random patient. The colorbar indicates the strength of connectivity between brain parcels.