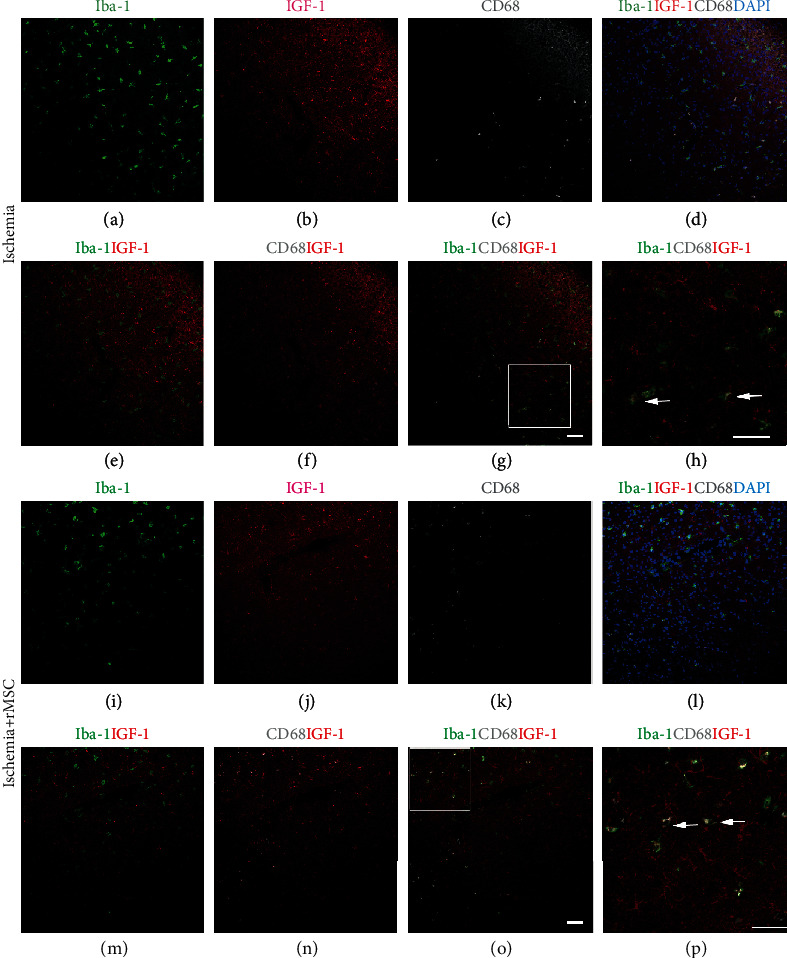
Figure 1.

The distribution of Iba-1+, IGF-1+, and CD68+ cells in the infarct area with and without MSC infusion. (a–h) Without MSC transplantation, the distribution of IGF-1+ and Iba-1+ cells in the infarct area. (i–p) With MSC transplantation, the distribution of IGF-1+ and Iba-1+ cells in the infarct area. (a, i) Iba-1staining in green. (b, j) IGF-1 staining in red. (c, k) CD68 staining in white. (d, l) Merged image of Iba-1, IGF-1, CD68, and blue DAPI nuclear staining. (e, m) Merged image of Iba-1 and IGF-1. Very few Iba-1+/IGF-1+ cells were scattered in the infarct area. (f, n) Merged image of CD68 and IGF-1. (g, o) Merged image of Iba-1, CD68, and IGF-1. (h) (square in (g)) and (p) (square in (O)) The IGF-1/Iba-1+ cells were CD68 positive, while the CD68-/Iba-1+ cells were negative for IGF-1. Arrow: IGF-1, Iba-1, and CD68 triple-labeled cells. Scale bar, 50 μm.
