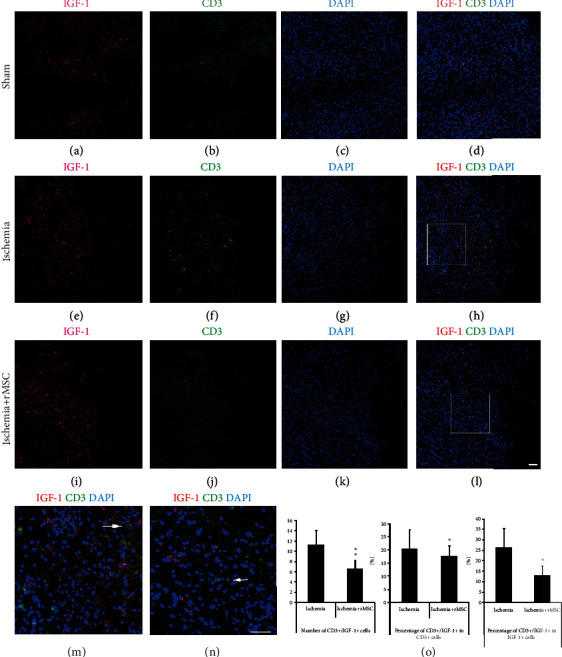
Figure 5.

CD3+ cells that express IGF-1 in the infarct area are reduced by MSC treatment. (a–d) In the sham group, CD3+ lymphocytes were barely observed in the brain. (e–h) CD3+ and CD3+/IGF-1+ cells increased significantly in the infarct area of the ischemia control group. (i–l) The number of CD3+ and CD3+/IGF-1+ cells in the infarct area was reduced dramatically by MSC transplantation. (a, e, and i) CD3 staining. (b, f, and j) IGF-1. (c, g, and k) DAPI nuclear staining. (d, h, and l) Double-stained CD3+/IGF-1+ cells. (m, n) (insets in (h, l)) The amplified view of CD3+/IGF-1+ cells in the ischemia and MSC transplantation groups. (o) The histogram of CD3+/IGF-1+ cell quantity and percentages in the ischemia group and MSC transplantation group (∗p < 0.05, ∗∗p < 0.01, compared with the ischemia vehicle group). Arrow: double-labeled cells. Scale bar, 50 μm.
