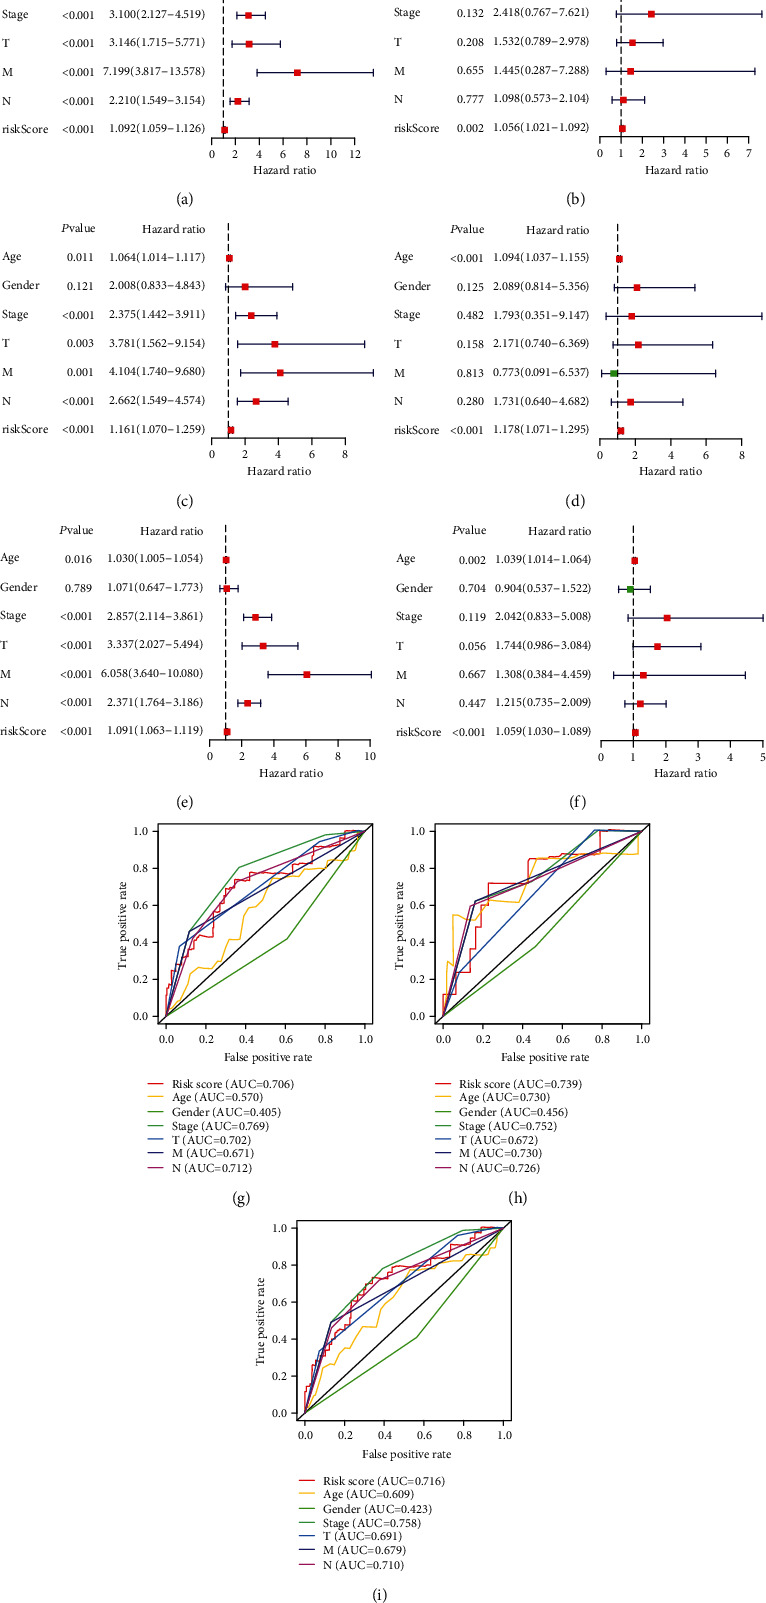
Figure 6.

Independent prognosis analysis in training, validation, and overall samples. (a–f) Respectively showed univariate and multivariate independent prognosis analyses between clinical characteristics and risk score in the training group, validation group, and overall samples, where the red squares represent the high-risk signature and the green squares represent the low-risk signature. (g–i) The comparison of AUCs between clinical characteristics and risk score in the training group, validation group, and overall samples.
