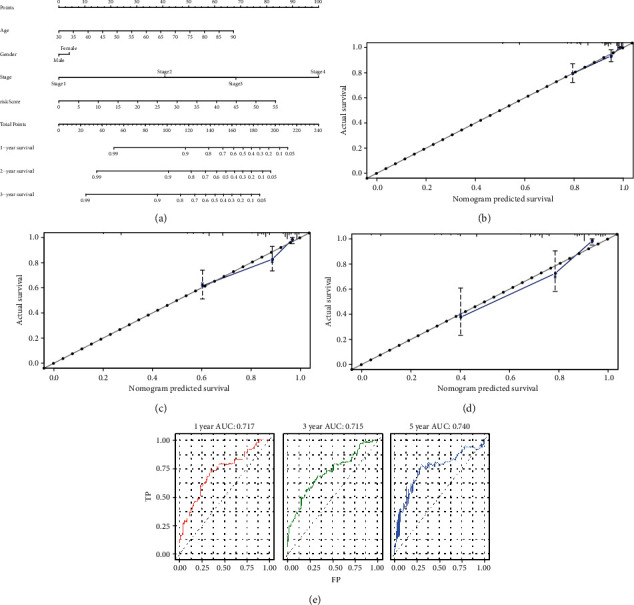
Figure 8.

(a) The four-signature nomogram. (b–d) The 1-year, 3-year, and 5-year survival calibration curves. (e) The time-dependent ROC showed the comparison of AUCs among 1-year survival rate, 3-year survival rate, and 5-year survival rate based on the nomogram.
